The Trophic Level Index (TLI) is a method of characterising the ecological health of lakes based on the amount of nutrients and algae growing in them. It provides an integrated measure of water quality that can be tracked over time and that can be used to estimate biological productivity. It is presented as a score, the lower the score the better the condition of the lake.
What do the TLI scores mean?
The Trophic Level Index gives an indication of lake water quality. The range of TLI scores can be divided into categories in Table 1 below.
LAWA Icon |
TLI Score |
Description |
 |
0 - 2 |
Microtrophic: The lake is very clean with very low levels of nutrients and algae. The lake can have snow or glacial sources.
|
 |
>2 - 3 |
Oligotrophic: The lake is clear and blue, with low levels of nutrients and algae.
|
 |
>3 - 4 |
Mesotrophic: The lake has moderate levels of nutrients and algae.
|
 |
>4 - 5 |
Eutrophic: The lake is murky, with high amounts of nutrients and algae.
|
 |
>5 | Supertrophic: The lake has very high amounts of phosphorus and nitrogen, and can be overly fertile and often associated with poor water clarity. Excessive algae growth can occur. Suitability for recreational purposes is often poor. |
Table 1. Lake Trophic Level Index scores.
How is TLI calculated?
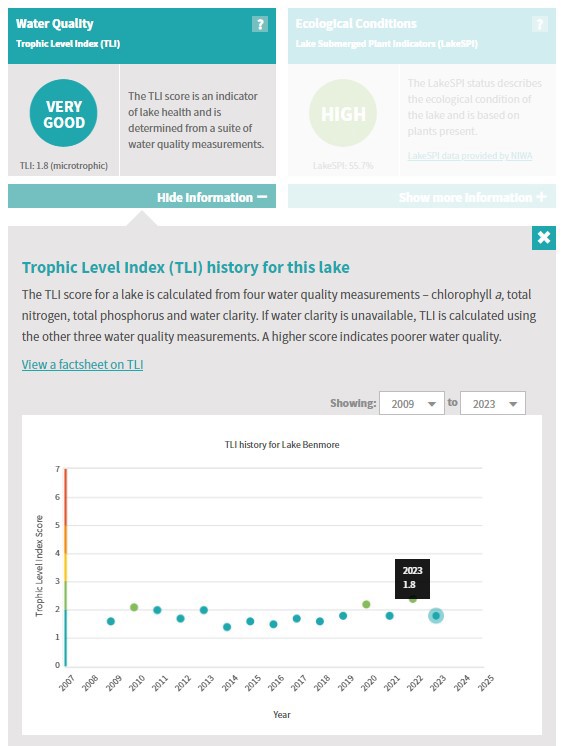
The TLI score for a lake is calculated using four separate water quality measurements – chlorophyll a, total nitrogen, total phosphorus and water clarity.
Chlorophyll a is an indicator of phytoplankton (algae) growth. Knowing how much chlorophyll a there is in a lake gives us a good idea of how much algae the lake has. It’s okay to have some algae in a lake and is in fact important for ecosystems, just not too much. The more algae present, the poorer the water quality.
Nitrogen and phosphorus are key nutrients that algae and plants thrive on. Large amounts of these nutrients in lakes encourage excessive growth of algae which can lead to poor water quality.
Water clarity is a measurement of how far down the water column you can see. In general, the clearer the water, the better the water quality. Water clarity in lakes is measured as Secchi disc depth.
Sometimes the water clarity measurement is not available. A typical example is where lakes are sampled by helicopter or from nearshore, both instances where measuring water clarity is often not feasible.
The TLI is calculated yearly using data collected between 1 July and 30 June (hydrological year). The LAWA lakes pages show TLI scores calculated from the four water quality measurements if available, and from the first three water quality measurements if clarity data are not available (TLI3).
Are there differences in TLI calculations across lakes?
As above, one difference in TLI calculation is whether water clarity is captured. To compare lakes across the country, in the Lake Health National Picture we calculate TLI scores using the three water quality measurements that are consistently available (chlorophyll a, total nitrogen and total phosphorus). In doing so, we focus on providing consistent and robust reporting of New Zealand lakes, so we can better understand their overall condition. Other national reports have employed the same strategy in order to avoid a potential source of variation (Kuczynski et al., 2024).
A strong correlation between TLI scores calculated with four or three water quality measurements has been reported, e.g. Verburg et al. (2010) and TLI3 has also been used in research studies instead of the TLI for broad scale comparisons of lake state and trends, e.g. Abell et al. (2020). However, information is lacking on any potential bias by using TLI3, as it is unknown how well TLI3 would correlate with TLI in the lakes for which we don't have water clarity data (Schallenberg and van der Zon 2021).
Other variables in TLI calculation include sampling frequency (number of data points per lake) and sampling location (e.g. mid-lake vs nearshore).
Sampling frequency is often determined upon inspection of the seasonal patterns for each variable, in each lake (Burns et al., 2000). Monitoring is carried out to get a baseline dataset, from which sampling frequencies can be optimised, and each council and unitary authority has adopted a strategy that best fits their region, their needs and their resources.
Monitoring of nearshore sites can be preferred to determine if point source inputs are affecting the lake’s health, as concentrations are likely to be higher closer to the sources (Burns et al., 2000).
As there are differences in monitoring regimes across the country, users should be aware of this when using TLI results to make comparisons between lakes and regions.
Does a lake’s TLI change?
Changes in a lake’s water quality will be reflected in the TLI score. Increasing TLI scores indicate that a lake is becoming nutrient enriched with an increasing likelihood of algae bloom events.
Efforts made by councils or landowners to reduce the amount of phosphorus and nitrogen entering the lake may lead to a lower TLI score over time. You can view a lake’s TLI history on LAWA by clicking the “Show more information” button.
Are there other ways to assess lake health?
LakeSPI and state attribute bands for a suite of water health indicators are also used to assess lake health.
TLI scores are available on LAWA for more sites than state attribute bands, as the sampling frequency requirement is less demanding. For example, Canterbury high-country lakes are sampled in a frequency (December to April only) that meets the LAWA data abundance requirements for calculating TLI, but not state attribute band calculations. See this factsheet for how state attribute bands are calculated in lakes.
Regional councils, unitary authorities and lake managers usually use all available information to assess a lake’s overall water quality.
Where do I find more information?
Abell JM, van Dam-Bates P, Özkundakci O, Hamilton DP (2020) Reference and current trophic level index of New Zealand lakes: benchmarks to inform lake management and assessment. New Zealand Journal of Marine and Freshwater Research 54: 636-657, doi: 10.1080/00288330.2020.1726974
Burns NM, Rutherford JC, Clayton JS (1999) A monitoring and classification system for New Zealand lakes and reservoirs. Journal of Lake and Reservoir Management, 15, 255-271.
Burns NM, Bryers G, Bowman E (2000) Protocol for monitoring trophic levels of New Zealand lakes and reservoirs. Ministry for the Environment, Wellington. 122 p.
Kuczynski A, G.R. Smith RGR, Fraser CE, Larned ST (2024) Environmental indicators of lake ecosystem health in Aotearoa New Zealand: current state and trends. Ecological Indicators, 165, 112185, https://doi.org/10.1016/j.ecolind.2024.112185
NIWA (2021). Water quality state and trends in New Zealand lakes. Analysis of national lakes data ending in 2020. Prepared for Ministry for the Environment.
Shallenberg M, van der Zon K (2021). Review of the Lake Trophic Level Index. Prepared for the Regional Council Lakes Focus Group.