Groundwater Quality
In New Zealand, groundwater is a valuable supply of fresh water for drinking water, irrigation and industry, and many of our streams and lakes.
New Zealand’s regional councils and unitary authorities regularly monitor groundwater quality in wells across the country. Here, you can explore the data collected from these wells and see how groundwater quality has changed over time. Learn more about what groundwater is and how this vital resource is monitored through our factsheets.
Select an indicator:
- Chloride
- Dissolved reactive phosphorus
- E. coli
- Electrical conductivity
- Nitrate nitrogen
View by:
What region are you interested in?
LAWA Groundwater Quality - National Picture Summary 2023
Publish date: 20 November 2023
Groundwater is a vital resource for New Zealand. It is widely used as a source of drinking water, whether by individual households with their own wells, or by communities and cities including Christchurch and Wellington. Groundwater is also used for irrigation and industry. It feeds many streams and lakes. Understanding the quality of groundwater helps us to manage land uses that affect it and the uses that depend on it.
Pathogens, nitrate-nitrogen (nitrate) and other contaminants can affect the suitability of groundwater for various uses. Groundwater contaminants, especially nitrate and phosphorus, can also affect water quality in spring-fed streams and lakes. Over-use of groundwater in coastal areas can draw seawater into aquifers, rendering the groundwater unsuitable for drinking or irrigation.
LAWA shows groundwater quality information from wells located throughout New Zealand. Data and information are available from around 1,000 wells. Regional councils and unitary authorities sample these wells annually, monthly or quarterly and test for a range of water quality indicators, five of which are displayed on LAWA: chloride, electrical conductivity, dissolved reactive phosphorus, E. coli and nitrate-nitrogen. State and trend analyses for these indicators have been updated using data up to the end of December 2022.
The data collected by regional councils and unitary authorities shows that while most groundwater in New Zealand is of very good quality, contamination from E. coli and nitrate does occur. All groundwater is potentially vulnerable to pathogen contamination (indicated by E. coli), so people should have their well water tested regularly if the water is used for drinking or preparing food. Nitrate concentrations exceed Drinking Water Standards for New Zealand in some wells, and long-term trends are variable, with roughly equal numbers of wells displaying improving and degrading trends. Seawater intrusion is not widespread, but continued monitoring is important so that we know if the situation changes.
This national picture presents an aggregated view of the state of groundwater quality in long-term monitoring wells and how the groundwater quality has changed over the past ten years. To see regional and local variations, we encourage you to explore the data from individual regional pages.
LAWA evaluates the five groundwater quality indicators against various thresholds, depending on the indicator. The state for any given year is a median value based on available data over the previous five years, except for E. coli where we report on whether E. coli has been detected at all over the previous five years. For more detail on how state values are calculated for groundwater quality, see this factsheet.
Nitrate-nitrogen
LAWA groups nitrate-nitrogen concentrations based on the Maximum Acceptable Value (MAV) in the Drinking Water Standards for New Zealand (11.3 mg/L) and half the MAV (5.65 mg/L). For more information, refer to the LAWA factsheet or to this page on the Ministry of Health website.
To help illustrate where lower concentrations occur, LAWA also defines a threshold of 1 mg/L based on the distribution of the data. Of the wells with median concentrations less than 5.65 mg/L, roughly half have state values (median concentrations) less than 1 mg/L, and half have concentrations between 1 and 5.65 mg/L.
Groundwater from about two thirds of the wells presented on LAWA has a five-year median concentration greater than 1 mg/L. For the most part, this reflects contamination from human activities. Concentrations are higher than half the MAV in around 25% of the wells presented, and they exceed the MAV in about 6% of monitored wells. There has been little change in these proportions over the past ten years (Figure 1).
The higher nitrate concentrations are generally found in areas of intensive agriculture, either grazing (for example Canterbury, Southland, Taranaki and Waikato) or vegetable farming (such as Pukekohe in Auckland and the Horowhenua in Manawatū-Whanganui). A few regions, such as Bay of Plenty, Gisborne and Marlborough, appear to have relatively low concentrations.
While nitrate-nitrogen concentrations have been fairly stable at the national level over the past ten years (Figure 1), at a regional level there is a mix of areas with improving and degrading trends. For more detailed information, you can browse LAWA to look at state and trends at individual wells.
LAWA National Groundwater Quality State Change Over Time (2013-2022)
Nitrate-Nitrogen
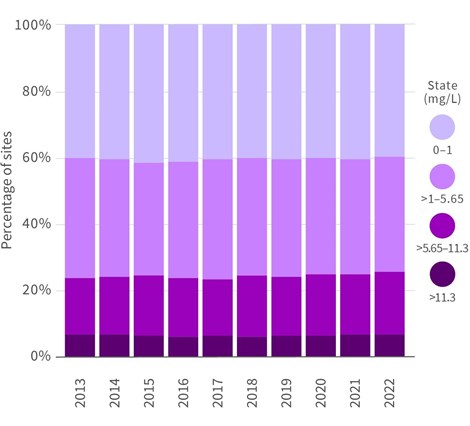
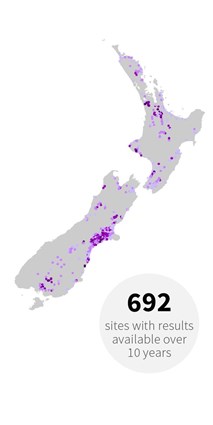
Figure 1. Changes in the state of nitrate-nitrogen concentrations from 2013-2022 in groundwater from the 692 wells where there were enough data to determine a result each year. The location of these monitoring sites and the current state result (2022) is shown on the map.
Dissolved reactive phosphorus (DRP)
There are no environmental or health thresholds for DRP concentrations in groundwater, so the results shown on LAWA are based on the distribution of the data. Approximately one third of the sites shown on LAWA fall into each of the three categories.
DRP can leach into groundwater from farm land, but for the most part, DRP concentrations in groundwater are related to aquifer material. Groundwater in volcanic rocks or limestone aquifers tends to have higher DRP concentrations because the aquifer material contains more phosphorus. This explains many of the higher DRP concentrations in the volcanic areas of Northland, Taranaki and Bay of Plenty, or in limestone aquifers in Hawke’s Bay and northern Canterbury.
In contrast, alluvial gravels derived from greywacke contain very little phosphorus. Therefore, groundwater beneath the Canterbury Plains and other alluvial gravel plains, such as in Tasman, Marlborough and West Coast, has relatively low DRP concentrations.
At a national scale, the number of wells in the lowest and middle concentration categories has varied somewhat over the past ten years (Figure 2). The reason for this is not yet clear. The number of wells in the highest concentration category has remained fairly stable.
LAWA National Groundwater Quality State Change Over Time (2013-2022)
Dissolved Reactive Phosphorus (DRP)
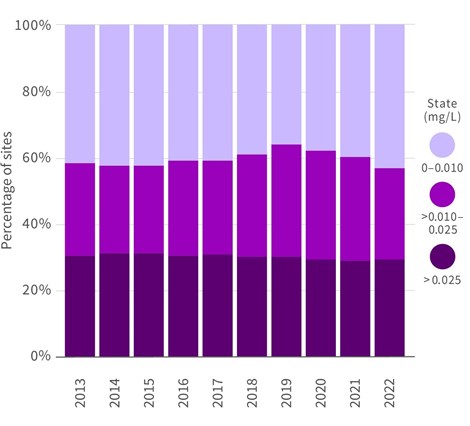
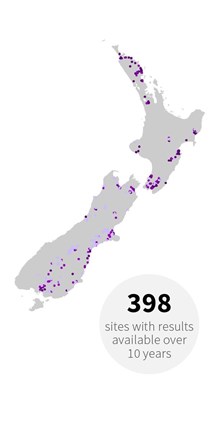
Figure 2. Changes in the state of dissolved reactive phosphorus (DRP) concentrations from 2013-2022 in groundwater from the 398 wells where there were enough data to determine a result each year. The location of these monitoring sites and the current state result (2022) is shown on the map.
E. coli
LAWA treats E. coli results differently to the results for the other four indicators. When calculating a value for state, LAWA considers whether E. coli was detected in any of the samples collected over the past five years. If so, the state for E. coli is shown as “detected”.
LAWA takes this approach because the most important thing about E. coli in a drinking-water sample is not the numerical result, but whether it is detected at all. If E. coli is detected, it indicates the presence of faecal material in the water and the risk that other harmful pathogens may also be present. In a broad sense, that risk increases with higher E. coli counts, but even an E. coli count of 1 in a 100 mL sample indicates a risk, and it exceeds the Drinking Water Standards for New Zealand.
Around half the wells presented on LAWA have had at least one E. coli detection in the past five years. This shows that groundwater supplies are widely vulnerable to faecal contamination. The most common sources of this contamination include grazing animals, farm effluent disposal and on-site wastewater systems.
In many cases, wells are contaminated by water at the land surface flowing directly into the well. This risk can be minimised by making sure the well head is secure. The area immediately surrounding a well should be fenced off to prevent stock access and kept clear of any potential contaminants. Well casing should be elevated above ground and above stormwater and flood levels. The top of the well should be securely sealed or capped, and any hoses or cables should also be securely sealed.
There is little pattern to where E. coli has been detected, except that contamination is most common where the water table is shallow. Even then, detections have been recorded in wells where the water table is more than 50 metres below the ground surface.
Figure 3 shows how E. coli detections have changed over the past ten years. There are 519 sites where we can calculate a state value for every year between 2013 and 2022. Overall, we see E. coli has been detected in around half of the long-term monitored wells. The proportion of wells where E. coli has been detected has varied slightly over time. In 2013, E. coli had been detected in 46% of long-term monitored wells over the previous five years (2009–2013). By 2020, that percentage had increased to 55%, and in 2022 the number of wells with E. coli detected over the previous five years had dropped slightly to 52% of wells.
As a final note, please keep in mind that the wells presented on LAWA are not all necessarily used for drinking water supply, and the results do not represent drinking water quality in New Zealand. The results represent the water from long-term monitoring wells that sample raw water before any treatment, which could then potentially be used for water supply.
LAWA National Groundwater Quality State Change Over Time (2013-2022)
E. coli
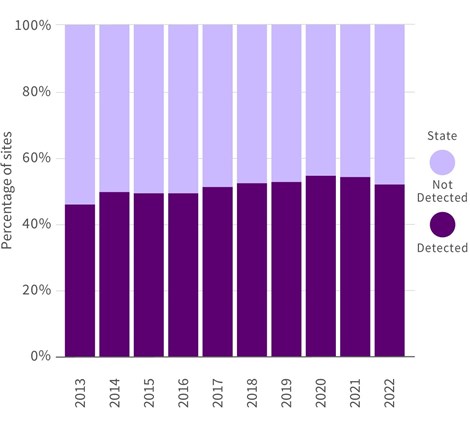
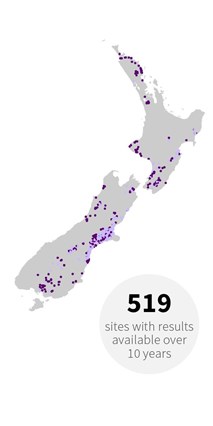
Figure 3. Changes in the state of E. coli detections from 2013-2022 in groundwater from the 519 wells where there were enough data to determine a result each year. The location of these monitoring sites and current state result (2022) is shown on the map. Note that unlike the other indicators shown on the page, which use median values, the state of E. coli in a given year is determined only by whether E. coli was detected in any sample over the preceding five-year time period.
Chloride
LAWA compares chloride state to thresholds based on the Aesthetic Values for Drinking Water set by Taumata Arowai. Chloride concentrations greater than the Aesthetic Value (250 mg/L) can affect the taste of water.
For the vast majority of wells, chloride concentrations in groundwater are far below the taste threshold, and this hasn't changed much over time (Figure 4).
The highest chloride concentrations are found in groundwater in coastal areas. In some cases, a very high concentration may indicate seawater intrusion, where overuse of a well can draw in seawater from offshore. Aquifer sediments deposited in marine environments may have a high salt content, which can lead to naturally elevated chloride concentrations in groundwater even many kilometres from the coast. Older groundwater and groundwater in volcanic rock aquifers may also have somewhat elevated chloride concentrations, though these concentrations are still likely to be well below taste thresholds.
LAWA National Groundwater Quality State Change Over Time (2013-2022)
Chloride
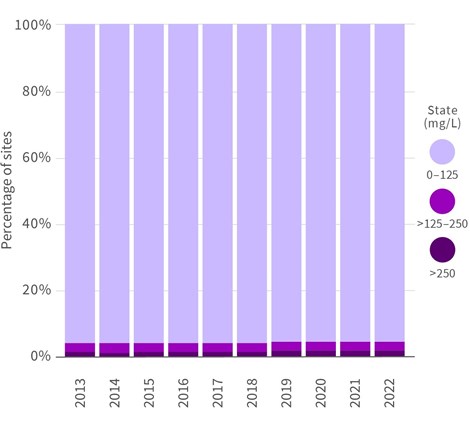
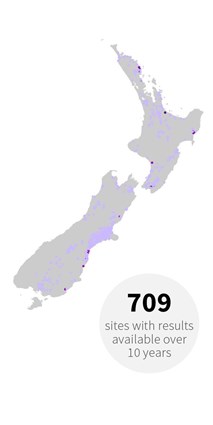
Figure 4. Changes in the state of chloride concentrations from 2013-2022 in groundwater from the 709 wells where there were enough data to determine a result each year. The location of these monitoring sites and the current state result (2022) is shown on the map.
Electrical conductivity
There are no environmental or health thresholds for electrical conductivity in groundwater. Electrical conductivity is closely related to the total concentration of salts dissolved in the water. LAWA separates electrical conductivity values into four ranges. For more detail, refer to this LAWA factsheet.
The lowest values reflect groundwater that is strongly influenced by seepage from an adjacent river or where land is not intensively farmed. Values in the two middle categories generally reflect leaching of salts from agricultural land. Groundwater with values in the highest range usually indicate interaction with aquifer material (such as limestone or volcanic rock) or sea water (in coastal areas).
At a national scale, the proportion of wells in each of these ranges remains fairly constant over time, though there appears to have been a slight increase over the past ten years in the numbers of wells in the two middle ranges compared to the lowest range (Figure 5). This suggests an overall increase in dissolved salt concentrations across the country. The reason for this is not clear. It may reflect ongoing land use intensification over the period, or it may be that ongoing pumping causes wells to draw older groundwater over time.
LAWA National Groundwater Quality State Change Over Time (2013-2022)
Electrical Conductivity
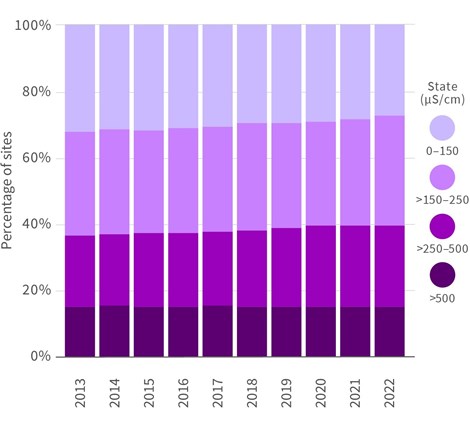
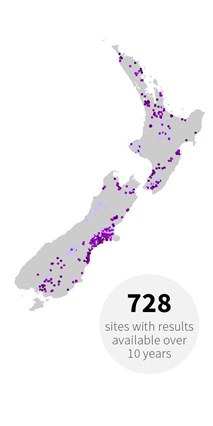
Figure 5. Changes in the state of electrical conductivity from 2013-2022 in groundwater from the 728 wells where there were enough data to determine a result each year. The location of these monitoring sites and the current state result (2022) is shown on the map.
Explore more on LAWA
This National Picture provides an aggregated overview of the state of groundwater quality across five indicators using data from regional councils and unitary authorities. Council groundwater quality monitoring programmes are designed to capture environmental state and trend on a regional scale.
Looking at data from individual wells provides further information about state and trend and additional details such as well construction. Information about monitored wells can be accessed either by clicking on a site dot on the map to the left of the LAWA main screen (desktop and tablet users), or by navigating via the region tab above, to select the region, then groundwater zone, and well site of interest. The organisation responsible for monitoring an individual site may be able to provide further contextual information about the results shown.
Select a monitored well from the list below
Show more
LAWA Groundwater Quality - National Picture Summary 2023
Publish date: 20 November 2023
Groundwater is a vital resource for New Zealand. It is widely used as a source of drinking water, whether by individual households with their own wells, or by communities and cities including Christchurch and Wellington. Groundwater is also used for irrigation and industry. It feeds many streams and lakes. Understanding the quality of groundwater helps us to manage land uses that affect it and the uses that depend on it.
Pathogens, nitrate-nitrogen (nitrate) and other contaminants can affect the suitability of groundwater for various uses. Groundwater contaminants, especially nitrate and phosphorus, can also affect water quality in spring-fed streams and lakes. Over-use of groundwater in coastal areas can draw seawater into aquifers, rendering the groundwater unsuitable for drinking or irrigation.
LAWA shows groundwater quality information from wells located throughout New Zealand. Data and information are available from around 1,000 wells. Regional councils and unitary authorities sample these wells annually, monthly or quarterly and test for a range of water quality indicators, five of which are displayed on LAWA: chloride, electrical conductivity, dissolved reactive phosphorus, E. coli and nitrate-nitrogen. State and trend analyses for these indicators have been updated using data up to the end of December 2022.
The data collected by regional councils and unitary authorities shows that while most groundwater in New Zealand is of very good quality, contamination from E. coli and nitrate does occur. All groundwater is potentially vulnerable to pathogen contamination (indicated by E. coli), so people should have their well water tested regularly if the water is used for drinking or preparing food. Nitrate concentrations exceed Drinking Water Standards for New Zealand in some wells, and long-term trends are variable, with roughly equal numbers of wells displaying improving and degrading trends. Seawater intrusion is not widespread, but continued monitoring is important so that we know if the situation changes.
This national picture presents an aggregated view of the state of groundwater quality in long-term monitoring wells and how the groundwater quality has changed over the past ten years. To see regional and local variations, we encourage you to explore the data from individual regional pages.
LAWA evaluates the five groundwater quality indicators against various thresholds, depending on the indicator. The state for any given year is a median value based on available data over the previous five years, except for E. coli where we report on whether E. coli has been detected at all over the previous five years. For more detail on how state values are calculated for groundwater quality, see this factsheet.
Nitrate-nitrogen
LAWA groups nitrate-nitrogen concentrations based on the Maximum Acceptable Value (MAV) in the Drinking Water Standards for New Zealand (11.3 mg/L) and half the MAV (5.65 mg/L). For more information, refer to the LAWA factsheet or to this page on the Ministry of Health website.
To help illustrate where lower concentrations occur, LAWA also defines a threshold of 1 mg/L based on the distribution of the data. Of the wells with median concentrations less than 5.65 mg/L, roughly half have state values (median concentrations) less than 1 mg/L, and half have concentrations between 1 and 5.65 mg/L.
Groundwater from about two thirds of the wells presented on LAWA has a five-year median concentration greater than 1 mg/L. For the most part, this reflects contamination from human activities. Concentrations are higher than half the MAV in around 25% of the wells presented, and they exceed the MAV in about 6% of monitored wells. There has been little change in these proportions over the past ten years (Figure 1).
The higher nitrate concentrations are generally found in areas of intensive agriculture, either grazing (for example Canterbury, Southland, Taranaki and Waikato) or vegetable farming (such as Pukekohe in Auckland and the Horowhenua in Manawatū-Whanganui). A few regions, such as Bay of Plenty, Gisborne and Marlborough, appear to have relatively low concentrations.
While nitrate-nitrogen concentrations have been fairly stable at the national level over the past ten years (Figure 1), at a regional level there is a mix of areas with improving and degrading trends. For more detailed information, you can browse LAWA to look at state and trends at individual wells.
LAWA National Groundwater Quality State Change Over Time (2013-2022)
Nitrate-Nitrogen
Figure 1. Changes in the state of nitrate-nitrogen concentrations from 2013-2022 in groundwater from the 692 wells where there were enough data to determine a result each year. The location of these monitoring sites and the current state result (2022) is shown on the map.
Dissolved reactive phosphorus (DRP)
There are no environmental or health thresholds for DRP concentrations in groundwater, so the results shown on LAWA are based on the distribution of the data. Approximately one third of the sites shown on LAWA fall into each of the three categories.
DRP can leach into groundwater from farm land, but for the most part, DRP concentrations in groundwater are related to aquifer material. Groundwater in volcanic rocks or limestone aquifers tends to have higher DRP concentrations because the aquifer material contains more phosphorus. This explains many of the higher DRP concentrations in the volcanic areas of Northland, Taranaki and Bay of Plenty, or in limestone aquifers in Hawke’s Bay and northern Canterbury.
In contrast, alluvial gravels derived from greywacke contain very little phosphorus. Therefore, groundwater beneath the Canterbury Plains and other alluvial gravel plains, such as in Tasman, Marlborough and West Coast, has relatively low DRP concentrations.
At a national scale, the number of wells in the lowest and middle concentration categories has varied somewhat over the past ten years (Figure 2). The reason for this is not yet clear. The number of wells in the highest concentration category has remained fairly stable.
LAWA National Groundwater Quality State Change Over Time (2013-2022)
Dissolved Reactive Phosphorus (DRP)
Figure 2. Changes in the state of dissolved reactive phosphorus (DRP) concentrations from 2013-2022 in groundwater from the 398 wells where there were enough data to determine a result each year. The location of these monitoring sites and the current state result (2022) is shown on the map.
E. coli
LAWA treats E. coli results differently to the results for the other four indicators. When calculating a value for state, LAWA considers whether E. coli was detected in any of the samples collected over the past five years. If so, the state for E. coli is shown as “detected”.
LAWA takes this approach because the most important thing about E. coli in a drinking-water sample is not the numerical result, but whether it is detected at all. If E. coli is detected, it indicates the presence of faecal material in the water and the risk that other harmful pathogens may also be present. In a broad sense, that risk increases with higher E. coli counts, but even an E. coli count of 1 in a 100 mL sample indicates a risk, and it exceeds the Drinking Water Standards for New Zealand.
Around half the wells presented on LAWA have had at least one E. coli detection in the past five years. This shows that groundwater supplies are widely vulnerable to faecal contamination. The most common sources of this contamination include grazing animals, farm effluent disposal and on-site wastewater systems.
In many cases, wells are contaminated by water at the land surface flowing directly into the well. This risk can be minimised by making sure the well head is secure. The area immediately surrounding a well should be fenced off to prevent stock access and kept clear of any potential contaminants. Well casing should be elevated above ground and above stormwater and flood levels. The top of the well should be securely sealed or capped, and any hoses or cables should also be securely sealed.
There is little pattern to where E. coli has been detected, except that contamination is most common where the water table is shallow. Even then, detections have been recorded in wells where the water table is more than 50 metres below the ground surface.
Figure 3 shows how E. coli detections have changed over the past ten years. There are 519 sites where we can calculate a state value for every year between 2013 and 2022. Overall, we see E. coli has been detected in around half of the long-term monitored wells. The proportion of wells where E. coli has been detected has varied slightly over time. In 2013, E. coli had been detected in 46% of long-term monitored wells over the previous five years (2009–2013). By 2020, that percentage had increased to 55%, and in 2022 the number of wells with E. coli detected over the previous five years had dropped slightly to 52% of wells.
As a final note, please keep in mind that the wells presented on LAWA are not all necessarily used for drinking water supply, and the results do not represent drinking water quality in New Zealand. The results represent the water from long-term monitoring wells that sample raw water before any treatment, which could then potentially be used for water supply.
LAWA National Groundwater Quality State Change Over Time (2013-2022)
E. coli
Figure 3. Changes in the state of E. coli detections from 2013-2022 in groundwater from the 519 wells where there were enough data to determine a result each year. The location of these monitoring sites and current state result (2022) is shown on the map. Note that unlike the other indicators shown on the page, which use median values, the state of E. coli in a given year is determined only by whether E. coli was detected in any sample over the preceding five-year time period.
Chloride
LAWA compares chloride state to thresholds based on the Aesthetic Values for Drinking Water set by Taumata Arowai. Chloride concentrations greater than the Aesthetic Value (250 mg/L) can affect the taste of water.
For the vast majority of wells, chloride concentrations in groundwater are far below the taste threshold, and this hasn't changed much over time (Figure 4).
The highest chloride concentrations are found in groundwater in coastal areas. In some cases, a very high concentration may indicate seawater intrusion, where overuse of a well can draw in seawater from offshore. Aquifer sediments deposited in marine environments may have a high salt content, which can lead to naturally elevated chloride concentrations in groundwater even many kilometres from the coast. Older groundwater and groundwater in volcanic rock aquifers may also have somewhat elevated chloride concentrations, though these concentrations are still likely to be well below taste thresholds.
LAWA National Groundwater Quality State Change Over Time (2013-2022)
Chloride
Figure 4. Changes in the state of chloride concentrations from 2013-2022 in groundwater from the 709 wells where there were enough data to determine a result each year. The location of these monitoring sites and the current state result (2022) is shown on the map.
Electrical conductivity
There are no environmental or health thresholds for electrical conductivity in groundwater. Electrical conductivity is closely related to the total concentration of salts dissolved in the water. LAWA separates electrical conductivity values into four ranges. For more detail, refer to this LAWA factsheet.
The lowest values reflect groundwater that is strongly influenced by seepage from an adjacent river or where land is not intensively farmed. Values in the two middle categories generally reflect leaching of salts from agricultural land. Groundwater with values in the highest range usually indicate interaction with aquifer material (such as limestone or volcanic rock) or sea water (in coastal areas).
At a national scale, the proportion of wells in each of these ranges remains fairly constant over time, though there appears to have been a slight increase over the past ten years in the numbers of wells in the two middle ranges compared to the lowest range (Figure 5). This suggests an overall increase in dissolved salt concentrations across the country. The reason for this is not clear. It may reflect ongoing land use intensification over the period, or it may be that ongoing pumping causes wells to draw older groundwater over time.
LAWA National Groundwater Quality State Change Over Time (2013-2022)
Electrical Conductivity
Figure 5. Changes in the state of electrical conductivity from 2013-2022 in groundwater from the 728 wells where there were enough data to determine a result each year. The location of these monitoring sites and the current state result (2022) is shown on the map.
Explore more on LAWA
This National Picture provides an aggregated overview of the state of groundwater quality across five indicators using data from regional councils and unitary authorities. Council groundwater quality monitoring programmes are designed to capture environmental state and trend on a regional scale.
Looking at data from individual wells provides further information about state and trend and additional details such as well construction. Information about monitored wells can be accessed either by clicking on a site dot on the map to the left of the LAWA main screen (desktop and tablet users), or by navigating via the region tab above, to select the region, then groundwater zone, and well site of interest. The organisation responsible for monitoring an individual site may be able to provide further contextual information about the results shown.