River Quality
Healthy rivers are essential to life in Aotearoa. They provide clean water for people and wildlife, support ecosystems, mahinga kai, recreation, and contribute to the economy by supporting tourism, agriculture, and other industries that rely on freshwater.
While many rivers are in good health, others are under pressure from pollution and land use activities.
Explore the National Picture for a summary of the latest results across the country, or visit the Regions tab to check water quality in rivers near you. Desktop and tablet users can also view monitored rivers using the interactive map.


Select an indicator:
- E. coli
- Clarity
- Dissolved Reactive Phosphorus
- Ammonia (toxicity)
- Nitrate (toxicity)
- Macroinvertebrate Community Index
View by:
Select trend period:
- 10 years
- 15 years
- 20 years
LAWA River Health - National Picture 2025
Published: 28 September 2025
Why river health matters
Healthy rivers are vital for our ecosystems, our communities, and our way of life. They:
-
provide clean water for people, plants, and animals
-
support mahinga kai, biodiversity, and recreation
-
provide water to grow our food, and power our businesses
-
reflect how land and water are being managed
What is monitored and shown on LAWA?
LAWA shares information on the health of almost 1700 rivers and streams across New Zealand. For the first time, this includes data from the Chatham Islands, plus analyses of 20-year trends for some sites.
Monitoring is carried out by regional councils and unitary authorities, along with Earth Sciences New Zealand (formerly NIWA), for a range of water quality and ecological indicators. The latest state and trend results use data collected up to June 2024.
What does this national picture cover?
This summary focuses on the state of our rivers and streams. Here we report on six indicators:
A biological indicator of the health of wadeable rivers and streams:
-
Macroinvertebrate Community Index (MCI) – a measure of the community of small stream animals (like insect larvae) that are sensitive to changes in water quality.
Water quality indicators contributing to river health:
-
Ammonia and nitrate toxicity – nutrients that can harm fish and other aquatic life at high levels.
-
Dissolved reactive phosphorus (DRP) – a nutrient that can cause problematic plant and algal growth.
-
Clarity – how clear the water is, affected by fine sediment that can smother habitats and make rivers less enjoyable for people.
An indicator of human health risk:
-
Escherichia coli (E. coli) – a bacteria that can indicate faecal contamination and the presence of harmful pathogens which may cause illness to recreational water users.
This summary looks at:
-
the current state of river health across New Zealand
-
how river health has changed over time
-
how results differ by land cover type (native and exotic forest, pasture, urban areas)
Not all rivers across New Zealand are monitored, and monitored sites are often in areas more at risk from human activities. This means the summary results are not necessarily a balanced representation of all rivers and streams across the country. That said, we can learn a lot from the monitoring histories of the 1700 river and stream sites that are regularly sampled.
How are results graded?
LAWA uses the attribute bands from the National Policy for Freshwater Management 2020 (NPS-FM 2020) to grade rivers from A (good) to D or E (poor). The ‘current state’ for 2024 is based on five hydrological years of monthly monitoring (from 1 July 2019 to 30 June 2024). Only sites with enough data were assigned an attribute band.
For details on how state is assessed, see this factsheet.
River health current state
The health of our rivers and streams varies depending on the indicator (Figure 1).
Ecological health:
-
Almost two-thirds of monitored sites show impaired health, with their Macroinvertebrate Community Index (MCI) graded in bands C or D.
Clarity and phosphorus:
-
Just over half of the sites across varying river sediment classes have good clarity (A band), but around 38% are in bands C or D, indicating that suspended fine sediment is potentially affecting aquatic life in those rivers.
-
For dissolved reactive phosphorus (DRP), which can contribute to excessive plant and algae growth, just over half of monitored sites are in band C or D. Some rivers are naturally high in DRP (which means poorer band scores) due to phosphorus-rich volcanic soils in their catchments.
Nitrate and ammonia toxicity:
-
Only a small percentage of sites show levels that are toxic to sensitive aquatic species. This means that toxicity is unlikely to be the main cause of widespread ecological health impairments seen in the MCI results.
Nitrogen enrichment:
-
Even at lower concentrations, nitrate and ammonia can still stimulate problematic plant and algae growth. This interacts with other impacts of human activities that reduce habitat quality, further reducing the capacity of rivers to support aquatic life. Under the NPS-FM 2020, councils are required to manage dissolved nitrogen forms (collectively called dissolved inorganic nitrogen – DIN) and DRP levels to protect stream ecological health. DIN results are not included in this national summary because they vary depending on each river’s environmental characteristics.
E. coli (human health risk):
-
Two-thirds of monitored sites are graded D or worse, indicating they are generally considered unsuitable for swimming. On average, this predicted risk of getting sick from swimming at these sites is greater than 3% on any given day. The risk is lower if swimming does not take place during high river flows.
Current state of river health (2024)


Figure 1. Attribute band results for six river health indicators across New Zealand. Each bar shows the percentage of monitored sites in each band, based on five years of data (July 2019–June 2024). The number of sites with suitable data to determine an attribute band for each indicator is shown below each bar, and their locations are shown on the map.
River health state over time
The above plot illustrates the current state of river health state, but how has this changed over time?
To understand long-term changes, we analysed sites with a near-complete sampling record over the last 15 years. This enabled us to calculate attribute bands for each five-year interval over the last decade (2015-2024). For example, results for 2015 are based on data collected over five hydrological years from 1 July 2010–30 June 2015.
The figures below (Figures 2-7) show results only for those sites that have this long and comprehensive sampling history, allowing comparisons from the same set of sites over time.
Mixed results across indicators
At a national level:
-
Some indicators, like DRP and ammonia (toxicity), show signs of positive change over time with an increase in the proportion of sites in healthier attribute bands.
-
Others, like MCI, show signs of worsening ecological health at some sites.
Macroinvertebrate Community Index (MCI)
Macroinvertebrates are sampled to assess the ecological health of wadeable streams and rivers. Sensitive macroinvertebrate species are only found in clean, healthy streams, while pollution-tolerant species dominate degraded sites.
The MCI scores the pollution tolerances of the species that make up the community at a river site. These species respond to multiple environmental pressures, including changes in physical habitat, oxygen levels, water temperature, food supplies, and climate effects.
Over the past 10 years (Figure 2), there has been:
-
a reduction in the number of sites in A and B bands
-
an increase in the number of sites in C and D bands
Sites graded in the A band are typically higher-elevation areas with more natural land cover. D band sites are typically in lowland, heavily modified catchments.
Improving MCI scores takes time, as it requires broad improvements in habitat, water quality, flow, and ecological function before sensitive species can return to these environments – so the response to interventions may be slower than for other indicators.
State change over time (2015-2024): Macroinvertebrate Community Index (MCI)

Figure 2. Changes in attribute bands for the Macroinvertebrate Community Index (MCI) from 2015-2024 at the 619 sites where there were enough data to determine a result each year. The location of these monitoring sites and current state attribute band (2024) is shown on the map.
Ammonia (toxicity)
Ammonia is one form of nitrogen found in waterways. At high levels, it’s toxic to aquatic fauna. Even at lower concentrations, it can still contribute to the growth of plants and algae.
-
Most monitoring sites have low ammonia levels where toxicity in unlikely, but levels may still contribute to excessive growth of instream plants or algae.
-
The proportion of sites in the A and B bands has increased over past decade (Figure 3), indicating improving conditions.
State change over time (2015-2024): ammonia (toxicity)

Figure 3. Changes in attribute bands for ammonia (toxicity) from 2015-2024 at the 389 sites where there were enough data to determine a result each year. The location of these monitoring sites and current state attribute band (2024) is shown on the map.
Nitrate (toxicity)
Nitrate is another common form of nitrogen present in aquatic environments. Like ammonia, it can contribute to growth of in-stream plant and algae biomass, but at high concentrations it becomes toxic to aquatic fauna.
-
Most monitoring sites had levels of nitrate nitrogen that were below levels where toxicity is likely. Sites assessed as being in the A or B bands for in-stream toxicity effects can still have nitrate levels that increase the risk of excessive algal growth, because this occurs at much lower concentrations than toxicity. The sites with potentially toxic (C and D band) concentrations of nitrate (which may affect sensitive species) are typically from lowland spring-fed streams with flow dominated by inputs of high nitrate groundwater.
-
Over the past 10 years, the proportion of sites in each band has remained relatively stable (Figure 4).
State change over time (2015-2024): nitrate (toxicity)


Figure 4. Changes in attribute bands for nitrate (toxicity) from 2015-2024 at the 423 sites where there were enough data to determine a result each year. The location of these monitoring sites and current state attribute band (2024) is shown on the map.
Dissolved reactive phosphorus (DRP)
Phosphorus is an essential nutrient contributing to the growth of algae and other aquatic plants in freshwater systems but can cause nuisance algal growth when concentrations are too high. The dissolved reactive form (DRP) is the most available for aquatic plant uptake.
-
The data show signs of positive change, with an increase in the number of sites in the A and B bands, and a corresponding decrease in the D band over time (Figure 5).
-
Elevated DRP levels are more common in lowland catchments and areas with heavily modified land and/or areas with naturally phosphorus-rich volcanic soils (more common in the North Island).
State change over time (2015-2024): dissolved reactive phosphorus (DRP)


Figure 5. Changes in attribute bands for dissolved reactive phosphorus from 2015-2024 at the 391 sites where there were enough data to determine a result each year. The location of these monitoring sites and current state attribute band (2024) is shown on the map.
Clarity (suspended fine sediment)
Fine sediment suspended in the water affects clarity, aquatic life, and recreational enjoyment. It can:
-
affect feeding behaviour for some aquatic organisms (they can’t see their food)
-
make it harder for fish to breathe (clogs up gills)
-
reduce amenity value (murky water is less pleasant for swimmers)
-
smother habitats on the streambed
-
carry nutrients like phosphorus
Fine sediment enters waterways through erosion, surface runoff from the land, streambanks, and some discharges. Land use and management practices can have a big effect on erosion and run-off of sediment, but natural features like slope, soil type, and rainfall also play a role. The NPS-FM 2020 accounts for these differences by categorising rivers and streams into four classes based on their climate, geology and slope, each of which have different expectations in terms of bottom lines for water clarity state.
-
Over the past 10 years, there has been a slight increase in the proportion of sites in the D band for the 94 sites that have a long monitoring record (Figure 6).
State change over time (2015-2024): clarity (suspended fine sediment)


Figure 6. Changes in attribute bands for clarity (suspended fine sediment) from 2015-2024 at the 94 sites where there were enough data to determine a result each year. The attribute band assessment takes into account the differences in state expected for the four suspended sediment classes in the NPS-FM 2020. The location of these monitoring sites and current state attribute band (2024) is shown on the map.
E. coli (faecal indicator bacteria)
E. coli is used as an indicator of faecal contamination from sources like livestock, birds, or untreated wastewater discharges. High levels are a concern as they suggest a greater risk of other harmful bacteria or pathogens in the water that could make people sick.
E. coli monitoring is conducted at popular swimming sites during the summer months as well as year-round at State of the Environment monitoring sites (regardless of the flow conditions and whether the site is physically suitable for swimming).
The data presented here are from year-round State of the Environment monitoring sites. Over the past 10 years:
-
Around 70% of monitored sites are scoring poorly and are in the D and E bands.
-
There’s been a slight decline in the proportion of sites in the A and E bands, and a slight increase in the proportion of D band sites (Figure 7).
Sites with poorer E. coli scores (D and E bands) are typically in lowland catchments with heavily modified catchments.
State change over time (2015-2024): E. coli


Figure 7. Changes in attribute bands for the faecal indicator bacteria E. coli from 2015-2024 at the 341 sites where there were enough data to determine a result each year. The location of these monitoring sites and current state attribute band (2024) is shown on the map.
Land cover and river heath
How land use affects river health
The way we use land in river catchments influences river health and water quality.
There is a general pattern across land cover types (Figures 8-13) where rivers and streams in areas dominated by native vegetation tend to be in the healthiest condition, followed by exotic forest areas, then pasture. Urban streams are usually the poorest.
River length by land cover type
Here’s how Aotearoa New Zealand’s river and stream lengths break down by land cover:
-
48% is in catchments mainly covered in native vegetation
-
45% is in pastoral (farming) catchments
-
5% is in exotic forest
-
1% is in urban catchments
While urban rivers and streams make up a small proportion of the total river network, they’re important to our communities - nearly 9 out of 10 New Zealanders live in urban areas. That means many people’s closest waterways are in urban settings, and these are often in poor health. For details on the calculation of land cover classes, see this factsheet.
Native vegetation can include other land cover types
Catchments in the native vegetation land cover class are the least affected by human activities but are not necessarily 100% native. These catchments may include some urban, pasture, or exotic forest areas upstream, provided native vegetation remains the dominant land cover.
Natural factors also play a role
It’s not just land use that affects water quality, geological differences (such as varying rock and soil types) can also contribute to differences in water quality. For example:
-
Catchments with volcanic soils can have naturally elevated phosphorus levels.
-
Streams that flow through wetlands or drain from high-organic-content soils (e.g. peat soils) may have elevated dissolved reactive phosphorus and ammonia.
These natural factors help explain why some sites in the “native vegetation” class don’t always score in the top A band.
Understanding lower scores in pastoral areas
Some sites in pastoral areas have lower scores for ammonia (toxicity) – falling into band C or D. It is important to know that around half of these lower scoring sites are from a single council monitoring specific point-source discharges, such as wastewater. These grades do not reflect the general condition and activities occurring across pasture catchments.
Current state by land cover class (2024): Macroinvertebrate Community Index (MCI)


Figure 8. Comparison of attribute bands for the Macroinvertebrate Community Index (MCI) across four land cover classes. Bands were calculated from data over a five-year hydrological period (July 2019–June 2024) at 1028 sites. The number of sites with suitable data to determine an attribute band for each land cover class is shown below each bar. The location and attribute band of monitoring sites are shown on the map.
Current state by land cover class (2024): ammonia (toxicity)


Figure 9. Comparison of attribute bands for ammonia (toxicity) across four different land cover classes. Bands were calculated from data over a five-year hydrological period (July 2019–June 2024) at 841 sites. The number of sites with suitable data to determine an attribute band for each land cover class is shown below each bar. The location and attribute band of monitoring sites are shown on the map.
Current state by land cover class (2024): nitrate (toxicity)


Figure 10. Comparison of attribute bands for nitrate (toxicity) across four different land cover classes. Bands were calculated from data over a five-year hydrological period (July 2019–June 2024) at 874 sites. The number of sites with suitable data to determine an attribute band for each land cover class is shown below each bar. The location and attribute band of monitoring sites are shown on the map.
Current state by land cover class (2024): dissolved reactive phosphorus (DRP)


Figure 11. Comparison of attribute bands for dissolved reactive phosphorus (DRP) across four different land cover classes. Bands were calculated from data over a five-year hydrological period (July 2019–June 2024) at 872 sites. The number of sites with suitable data to determine an attribute band for each land cover class is shown below each bar. The location and attribute band of monitoring sites are shown on the map.
Current state by land cover class (2024): clarity (suspended fine sediment)


Figure 12. Comparison of attribute bands for clarity (used as a proxy for suspended fine sediment) across four different land cover classes. Bands were calculated from data over a five-year hydrological period (July 2019–June 2024) at 442 sites. These results take into account the suspended sediment classes defined in the NPS-FM 2020. The number of sites with suitable data to determine an attribute band for each land cover class is shown below each bar. The location and attribute band of monitoring sites are shown on the map.
Current state by land cover class (2024): E. coli


Figure 13. Comparison of attribute bands for the faecal indicator bacteria E. coli across four different land cover classes. Bands were calculated from data over a five-year hydrological period (July 2019–June 2024) at 773 sites. The number of sites with suitable data to determine an attribute band for each land cover class are shown below each bar. The location and attribute band of monitoring sites are shown on the map.
River health monitoring and reporting
The role of long-term monitoring
Understanding how river and stream health is changing over time relies on high quality data from long-term monitoring programmes. LAWA publishes State of the Environment river health data from 2004 onwards, covering river water quality and macroinvertebrate monitoring.
There are now over 2 million monitoring records in the LAWA river dataset - reflecting significant effort and investment by regional councils, unitary authorities, research agencies, and others. While extreme weather events and other challenges (e.g. COVID lock-downs) have occasionally created data gaps, these are openly acknowledged and carefully managed to minimise their impact.
Moving toward a more complete picture
As long-term datasets grow, the LAWA project will continue working to align reporting with national environmental legislation and look for opportunities to include a wider variety of indicators.
Supporting consistency through national standards
LAWA project partners are also working to improve the consistency of environmental monitoring across New Zealand. This includes the development and use of National Environmental Monitoring Standards (NEMS).
As part of the state and trend analysis, lower-quality data are excluded - either through a council’s internal coding systems or via national best practice standards under the NEMS Quality Coding framework. As more organisations adopt these standards, we expect to see continued improvements in the availability and quality of environmental data.
Monitoring to inform actions and track progress
Understanding lag times in environmental recovery
Across the country, there is significant work underway to restore the health of waterways. However, environmental improvements often take time. There can be a lag between actions taken on the land – such as new farm practises or urban planning rules – and measurable results in our rivers and lakes.
Tracking land and waterway management actions provides a more immediate indicator of progress, but this data has typically been unavailable or difficult to access at a national level.
To help close this gap, LAWA now includes a dedicated section on Actions for Healthy Waterways. This topic is designed to highlight the restoration and protection efforts across catchments. By gathering and reporting on these actions, we can better link the on-the-ground efforts to environmental outcomes, understand what works best, and help guide future efforts.
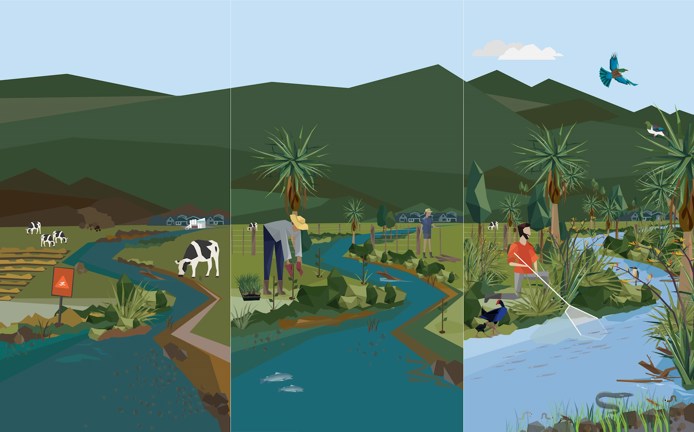
Figure 14. A graphic example of a river journey towards restored ecosystem health. The river under pressure with degraded ecosystem health (left panel), actions underway to restore the river (centre panel), and a thriving river ecosystem in the future (right panel).
Explore more on LAWA
Looking at individual site data alongside contextual information at a catchment and regional level is useful for mana whenua, community groups, landowners, and others interested in how local waterways are tracking.
To view a specific site:
-
on a desktop or tablet: click a site dot on the map on the LAWA homepage
-
or navigate by region > catchment > site
For more detail, the organisation responsible for monitoring a site can provide additional insights into the data and information shown.