
What do we mean by 'state'?
On LAWA, we use the term 'state' to describe the current condition at a river or stream site for a given water quality indicator.
Why do we assess the state of river health?
Understanding the current state of our rivers and streams helps to:
- describe how healthy our monitored waterways are across Aotearoa
- identify pressures on river ecosystems and risks to human use
- track progress towards national and regional goals for freshwater
- support decisions about how we use our natural resources
Human activities will always have some impact on waterways because of the way we live and use land. It is unlikely that many water bodies in New Zealand can be restored to their pre-human state. Even in places where human pressures could almost be completely removed, such as within national parks, introduced aquatic species, along with native and exotic birds, insects, pest mammals, and natural processes such as erosion and atmospheric pollution, continue to affect the health of our waterways to some extent.
How is state calculated for our rivers and streams?
Current state in the LAWA River Quality topic is described using two independent methods:
- state quartiles
- state attribute band scores
The state quartiles are a relative measure at the national scale, comparing sites against each other, while the attribute band scores are an absolute measure, evaluating each site against expectations of water quality values in the National Policy Statement for Freshwater Management 2020 (NPS-FM 2020).
Data preparation and quality control
Data is collated from monitoring data supplied by councils and Earth Sciences New Zealand (formerly NIWA). Before state is calculated, all results are screened to remove data of a lesser quality based on the Quality Code (QC) information provided by councils:
- All measurements with standard NEMS* QC codes: 100 (missing data) and 400 (measured value may have been compromised and/or undergone significant modification and therefore may not be representative of the intended measurement) are removed.
- Related internal council QC 400 child codes (e.g. 403, 404, 450) are also removed.
- Equivalent 'poor quality' codes from council-specific QC systems (e.g. Auckland codes 41, 61, 100, 42 and 151) are excluded as well.
*NEMS are National Environmental Monitoring Standards which are part of ongoing data improvement processes that councils are actively working on to implement.
State quartiles
The state quartile values presented for the river water quality sites on LAWA are based on the median of monitoring results from the last five hydrological years (July 2019-June 2024). The data used to calculate state quartiles for rivers is collected monthly, bimonthly or quarterly.
Minimum data requirements for state quartiles
A median value is calculated when there is at least:
- 50% of monthly data (30 of 60 monthly samples), or
- 80% of bimonthly data (24 of 30 bimonthly samples), or
- 80% of quarterly data (16 of 20 quarterly samples).
The quartile ranking is derived by comparison of each site’s median with that from other sites. The quartile ranking describes how each site ranks relative to the others – the 1st quartile being the best quarter, the 4th quartile being the worst quarter.
|
Q1: Best 0-25% of sites |
Q2: Best 25-50% of sites |
Q3: Worst 25-50% of sites |
Q4: Worst 0-25% of sites |


For river water quality indicators, quartiles can be derived for a site by comparing its median values with:
- all other sites around the country, or
- sites with similar catchment land use, and/or
- sites with similar altitudes (upland or lowland).
Thus, a single site may have various quartile scores, depending on the group it’s being compared against.
The land cover classification for the river reach that a site is located on, reflects the dominant upstream land cover, grouped as forest (native and exotic), urban or rural. For example, if the catchment upstream of a reach is 50% or more covered in ‘forest’, the reach’s land cover is classified as forest, however, if the catchment of a reach is 15% or more covered by urban land cover, the reach’s land cover classification is over ridden as urban. These land cover definitions are based on the New Zealand River Environment Classification (REC). At some sites, the REC classification does not reflect current land cover, and in these cases, councils have provided LAWA with an updated catchment land cover classification.
State attribute band scores
LAWA evaluates state (current conditions) at sites nationwide against attribute bands described in the National Policy Statement for Freshwater Management 2020 (NPS-FM 2020),
The NPS-FM 2020 requires the management of freshwater in a way that ‘gives effect’ to Te Mana o te Wai, and sets up requirements for regional councils and unitary authorities in setting objectives, policies and rules to manage freshwater in their regions. The characteristics of the water that need to be managed are referred to as ‘attributes’ in the NPS-FM 2020, and 'indicators' on LAWA.
Each indicator's state is defined by attribute bands, from A (good) to D or E (poor).

Councils, along with their communities, need to set ‘target attribute states’ (attribute bands) for sites in their region. For many indicators there is a national bottom line value and councils and their communities need to aim above that bottom line, unless there is a specific justification why that would not be achievable (e.g., the existing freshwater quality is caused by naturally occurring processes, or a specific time-limited exemption applies). As part of setting target attribute states, councils will also set timeframes as to when these will be achieved.
Minimum data requirements for determining attribute bands
The 'current state' for 2024 at each river site is based on data from the previous five hydrological years (July 2019-June 2024).
Minimum data abundance requirements must be met before a grade can be assigned, so not all sites featured on LAWA can be assigned an attribute band.
Water quality monitoring network sites
LAWA calculates the state of river water quality sites using monthly data. For ammoniacal nitrogen (as ammonia toxicity*), clarity (suspended fine sediment**), dissolved reactive phosphorus, nitrate nitrogen (as nitrate toxicity***), and E. coli, LAWA requires:
- at least 90% of samples (54 of 60), and
- at least 90% of of quarters (18 of 20) represented within the five hydrological year period.
*To determine ammonia toxicity attribute bands, LAWA uses pH adjusted ammoniacal nitrogen data, meaning that pH measures must also be available.
**At some sites clarity is not measured and, where available, turbidity measurements have been converted to clarity data to determine the attribute band for clarity (suspended fine sediment).
***For sites where there are no long-term nitrate nitrogen data available, total oxidised nitrogen data have been used to calculate the attribute band for nitrate (toxicity).
Ecological health monitoring network sites
LAWA calculates the state of sites monitored for five indicators of ecological health:
- Macroinvertebrate Community Index (MCI)
- Quantitative Macroinvertebrate Community Index (QMCI)
- Macroinvertebrate Average Score Per Metric (ASPM)
- taxonomic richness
- % EPT
These indicators are generally measured once per year and the state presented for these sites uses the median calculated from data over the last five hydrological years (July 2019-June 2024). LAWA requires a minimum of four data points from the last five years for a median value to be calculated. Attribute bands shown for MCI, QMCI and ASPM were determined using the numeric attribute states in the NPS-FM 2020.
Assigning attribute bands
When attributes (indicators) in the NPS-FM 2020 include multiple statistics calculated from monthly data, the overall attribute band for the indicator is determined by the worst of those statistics. For example, if the nitrate (toxicity) median result qualifies as an A band and the 95th percentile result qualifies as a B band, the site is assigned a B attribute band.
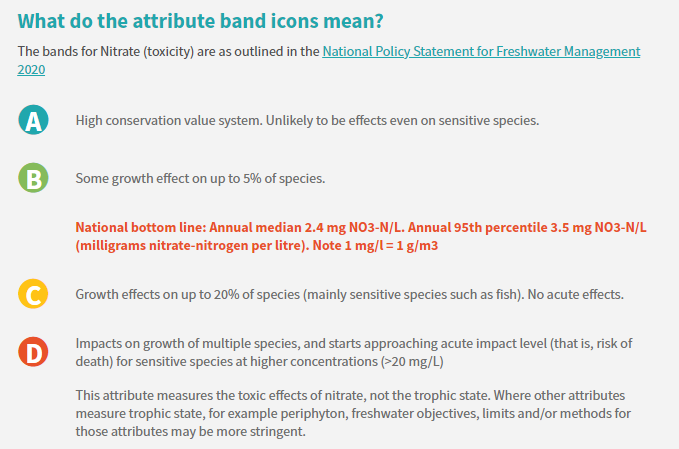
What do the state bands tell us?
- Band A represents the best conditions (high ecological health or low risk to human use).
- Bands B - D (or E) represent progressively worse conditions and higher risk.
- State provides a snapshot, not a long-term trend. For changes over time, see factsheet on calculating water quality trends in rivers.
On LAWA, attribute bands are colour-coded to make interpretation easier. Here is an example of the coloured bands, alongside descriptions of state attribute bands (for nitrate toxicity):
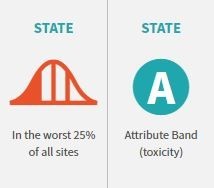
The difference between state quartiles and attribute band scores
State quartiles are a useful comparative ranking. They show how a site compares against other monitored sites, whereas the attribute band provides an absolute ‘score’ against a standard for some water quality indicators.
For some sites the water quality may be good (and score “A” under the NPS-FM 2020), yet still be in the 4th quartile relative to other sites. This happens when all the sites are good (and meet the attribute band “A” definition) but some will still be better than others, leaving a quarter of sites in the 4th quartile. On LAWA that looks like this:
National Picture Summary - Additional Notes
The Land Cover classes (Native vegetation, Exotic forest, Pasture, and Urban) used in the national picture summary were grouped using the following approach:
LAWA land cover data was acquired on a per-site basis, using the NZREACH that each site fell on, to extract land cover from the River Environment Classification (REC) database. For the native land cover category, we grouped wetland, tussock, scrub and bare (alpine) ground along with indigenous forest. The pastoral land cover category was grouped with miscellaneous, and we kept REC's exotic forest and urban categories. REC determines the land cover category for each reach by calculating the most influential land cover in the catchment upstream, using data from the New Zealand Land Cover Database (LCDB), and acknowledging that less urban cover is required (by area) for it to be most influential.
The REC assigned a category to each reach based on dominance rules for the catchment land cover upstream. “The Land-Cover type that was present in the greatest percentage was deemed to be the dominant land cover unless Pastoral exceeded 25% in which case the class was set to Pastoral (P) or if Urban exceeded 15% in which case the class was set to Urban (U). If both Pastoral and Urban exceeded their respective thresholds then Urban was assumed to be the most dominant.[1]”
[1] New Zealand River Environment Classification User Guide, Snelder T., Biggs, B., Weatherhead M. (2004, updated 2010) MfE, NIWA. https://www.mfe.govt.nz/sites/default/files/environmental-reporting/about-environmental-reporting/classification-systems/rec-user-guide-2010.pdf