Understanding the land cover information presented
The New Zealand Land Cover Database (LCDB) version 5.0 provides a series of ‘snapshots’ of land cover in the form of maps derived from satellite imagery across the country, covering the dates: 1996, 2001, 2008 2012 and 2018. At each snapshot, the satellite images are analysed and land cover types are assigned to detailed classes, such as ‘urban area’, ‘depleted grassland’, and ‘gorse and broom’ (see the factsheet ‘Land cover and why it is important’ for the definition of the detailed classes). The 34 detailed classes are then grouped to form meaningful classes for reporting at two levels of detail, the medium level (comprising 12 classes) and the broad level (comprising 6 classes). The medium and broad classes are presented in the Land Cover topic in LAWA.
The primary indicator reported on in the Land Cover topic is the area of land under each land cover class, at each LCDB snapshot date. The area information for each class, at each date, is presented as either an area value in hectares (ha) or as a proportion (%) of the total land area being considered (which is either the total land area of New Zealand for the national picture, the total land area of a region for the regional picture, or the total land area of a catchment within a region). An example of the land cover indicator data presented in LAWA (for the national picture) is given in Table 1. Examining the area of land under the land cover classes as a proportion of the total land area being considered is useful because it describes the relative predominance of the classes within a catchment, a region, or nationally. For example, if exotic grassland covers 65% of a region’s land area and indigenous forest covers 26% of that region’s land area, this tell us that exotic grassland is the predominant land cover in that region and, together with indigenous forest, the two covers account for most (91%) of that region’s land area.
Table 1. An example of the land cover indicator data presented in LAWA (for the national picture).
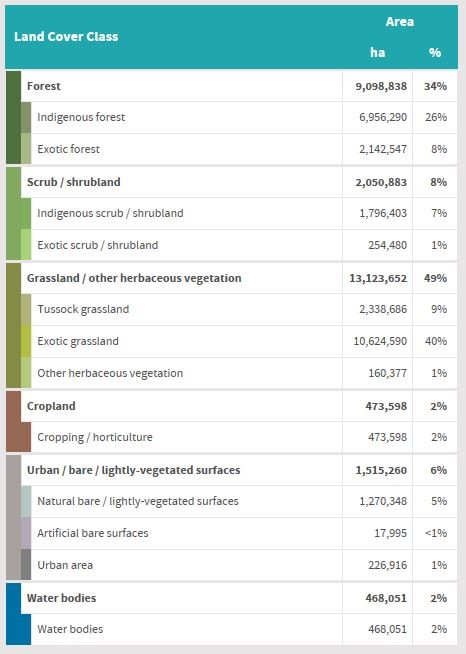
Note that if the area of a land cover class, expressed as a proportion of the total area being considered (e.g. a region), has a value of less than 1% (e.g. 0.3%), the value will be presented as <1% (e.g. Artificial bare surfaces in Table 1 above).
What is land cover state and how is it calculated?
The land cover state is the area of land under each land cover class, at a particular LCDB snapshot date, primarily expressed as either a proportion (%) of the total land area being considered. The ‘current’ state is represented by the most recent snapshot date (i.e. 2018). Data for the 1996, 2001, 2008 and 2012 snapshot dates represents past states. The user can choose to view the data for a past state by selecting the snapshot date of interest. However, the narrative text describes the current state (2018) only. State data are presented for the broad- and medium-level classes in the Land Cover topic. The state data relating to the detailed classes can be viewed by downloading the data in spreadsheet form. An example of the presentation of the state data in the form of a ‘donut’ graph in the LAWA Land Cover topic is given in Figure 1 below. The user can hover over the different segments in the graph to view the proportion of the total land area covered by each class.
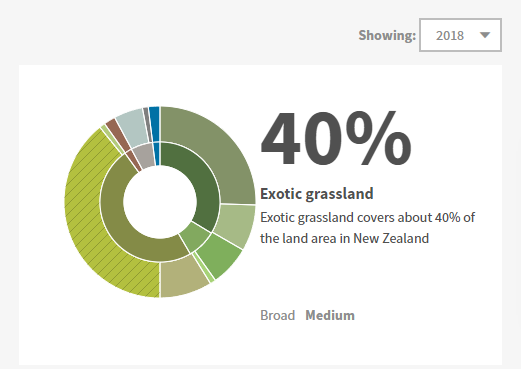
Figure 1. An example of a ‘donut’ graph used in the LAWA Land Cover topic to present the state data for both the broad and medium land cover classes.
In simple terms, the area values for each land cover class are calculated by interrogating the LCDB version 5.0 maps (reclassified according to either the broad, medium, and detailed class definitions), overlain by regional and catchment boundaries (depending on the land area being considered), at each snapshot date using a Geographic Information System (GIS). For example, if the area being considered is a region, the area of every occurrence of each land cover class within the regional boundary (based on the 2018 regional boundary layer, provided by Statistics NZ) is summed to give the regional total for each class. The GIS analysis also provides the total land area for each region or catchment to enable the land cover class areas to be expressed as a proportion of the total area being considered (e.g. the total land area of a region). A map of the broad land cover classes in the North Island overlain by regional boundaries is shown in Figure 2.
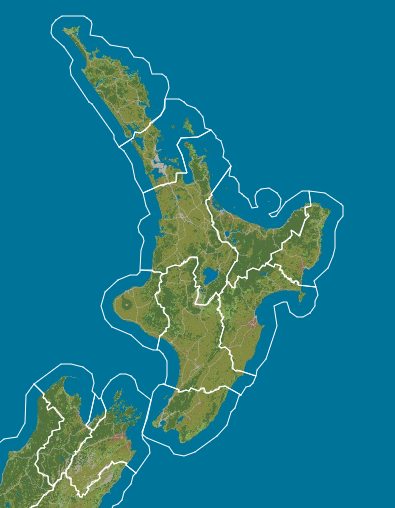
Figure 2. A map of the broad land cover classes in the North Island as at 2018 overlain by regional boundaries (white outline) as presented in the LAWA Land Cover topic.
More information
See the factsheet on calculating land cover trend here