
What is land cover trend?
The land cover trend describes the change in land cover state over a defined time period (e.g. between the 1996 and 2018 snapshot dates).
How land cover calculated?
It was decided that the 1996 snapshot, being the earliest measurement date, would be used as the baseline against which change in land cover state over the monitoring period (through to 2018) would be primarily assessed. This change over time is presented as both an area change value in hectares (ha) and as proportional (%) change (the area change expressed as a proportion of the 1996 area) for each land cover class. The trend information shows us the extent to which the land cover classes have either increased, decreased, or remained unchanged in area over the monitoring period (i.e. 1996 to 2018). Trend data is presented for both the broad and medium land cover classes. Figure 1 provides an example of how the area change data is presented in LAWA. Hovering over the bars in the graph reveals a label with the proportional change for each category. The trend data relating to the detailed classes can be viewed by downloading the data in spreadsheet form.
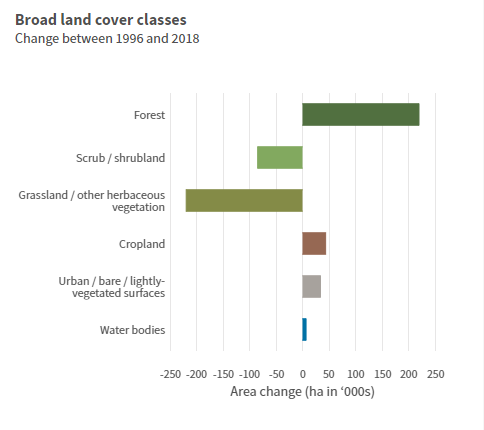
Figure 1. An example of the presentation of the area change data (for broad level classes) in LAWA.
Trend calculations were made using the land cover class area data derived from the GIS analysis (described in the calculating land cover state factsheet). To calculate area change, the area of a given land cover class at the 1996 snapshot was subtracted from the area of that class at the 2018 snapshot. A positive area change value (e.g. 6,000 ha) indicates and increase in the area of a class between 1996 and 2018, whereas a negative area change value (-6,000 ha) indicates a decrease in area over the period. The area change value divided by the area for the same class at the 1996 snapshot (and multiplied by 100), gives the proportion changed expressed as a percentage (%). Table 1 provides an example of the presentation of the area change data in LAWA.
Table 1. An example of the area change data (for broad land cover classes) presented in LAWA.
The area (ha) under each broad and medium land cover classes at each of the snapshot dates is also plotted as a line graph to provide more detail around how land cover has changed over time. Users can select which broad- or medium-level classes they wish to display on this graph (Figure 2).
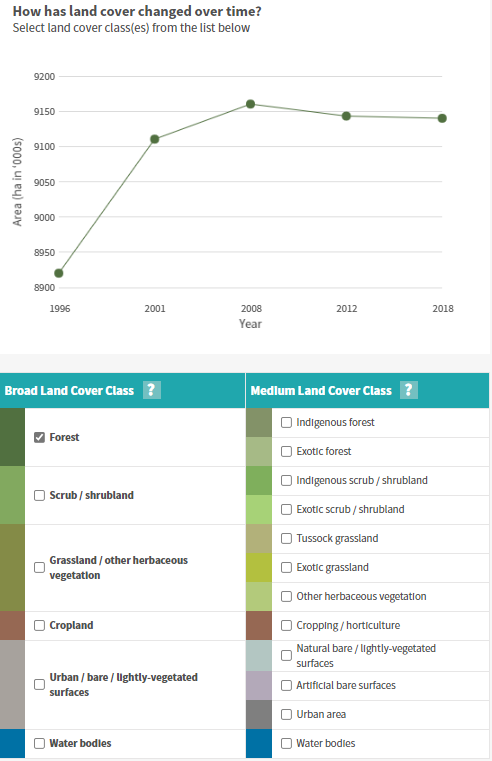
Figure 2. An example of the line graph presenting land cover class area change over time in LAWA.
Further information
Monitoring land cover in New Zealand factsheet