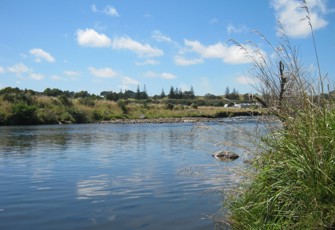
This site is located at the bottom of the Waiwhakaiho River, near the coastal walkway and Te Rewa Rewa Bridge. The Waiwhakaiho drains an extensively developed farmland catchment and flows through six kilometres of urban New Plymouth before reaching this popular recreational area, which is about 700m from the sea. This site is used mainly for whitebaiting (in season), and walking.
Permanent warning signs are located along the river advising the public that the site regularly exceeds the microbiological water quality guidelines, and is often unsuitable for swimming. Large flocks of seagulls and ducks are present in the lower reaches between Merrilands Domain and this site, and investigations have shown that bird excrement is the main cause of water quality failing to meet safe swimming guidelines.
Please note that water quality can change depending on weather. Don't swim if the water is murky or smells unpleasant. Taranaki Regional Council advises not to swim within three days of heavy or prolonged rainfall, even at sites that usually have good water quality.
This dashboard shows information on macroinvertebrate data collected by regional councils and unitary authorities. Select an indicator to see the available historical results.
Select a time period
- 10 years
- 15 years
State
Attribute BandTrend
Sample history at this site
What is this graph showing me?
This graph is displaying MCI scores over the selected time period. You can adjust this period by changing the dropdowns. These records for the basis for the state and trends displayed on the dashboard.
Find out about how State and Trend are calculated.
What do the attribute band icons mean?
The bands for MCI are as outlined in the National Policy Statement for Freshwater Management 2020
State
Attribute BandTrend
Sample history at this site
What is this graph showing me?
This graph is displaying QMCI scores over the selected time period. You can adjust this period by changing the dropdowns. These records for the basis for the state and trends displayed on the dashboard.
Find out about how State and Trend are calculated.
What do the attribute band icons mean?
The bands for QMCI are as outlined in the National Policy Statement for Freshwater Management 2020
State
Attribute BandTrend
Sample history at this site
What is this graph showing me?
This graph is displaying ASPM scores over the selected time period. You can adjust this period by changing the dropdowns. These records for the basis for the state and trends displayed on the dashboard.
Find out about how State and Trend are calculated.
What do the attribute band icons mean?
The bands for ASPM are as outlined in the National Policy Statement for Freshwater Management 2020

