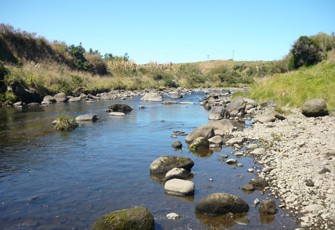
This site is located in the lower reaches of the Waingongoro River, immediately upstream of the mouth at Ōhawe Beach, but is generally not tidal. Occasional upstream surging in the ponded area has, however, been noted during low river flow and high tidal conditions during late summer. The Waingongoro River drains an extensively farmed catchment and receives point-source treated industrial waste discharges (in its mid-reaches), as well as treated waste discharges from dairy ponds.
The main recreational activities carried out at this site include whitebaiting (in season), fishing, picnicking, and some swimming.
Macroinvertebrates have been monitored at this site since 1995. Taranaki Regional Council uses a modified macroinvertebrate taxa list tailored to reflect ecological conditions specific to Taranaki. While this influences the metrics reported by the Council, the data shown on LAWA is based on national scoring methods, which may differ slightly from the Council's internal reporting.
This dashboard shows information on macroinvertebrate data collected by regional councils and unitary authorities. Select an indicator to see the available historical results.
Select a time period
- 10 years
- 15 years
- 20 years
State
Attribute BandTrend
Sample history at this site
What is this graph showing me?
This graph is displaying MCI scores over the selected time period. You can adjust this period by changing the dropdowns. These records for the basis for the state and trends displayed on the dashboard.
Find out about how State and Trend are calculated.
What do the attribute band icons mean?
The bands for MCI are as outlined in the National Policy Statement for Freshwater Management 2020
State
Attribute BandTrend
Sample history at this site
What is this graph showing me?
This graph is displaying QMCI scores over the selected time period. You can adjust this period by changing the dropdowns. These records for the basis for the state and trends displayed on the dashboard.
Find out about how State and Trend are calculated.
What do the attribute band icons mean?
The bands for QMCI are as outlined in the National Policy Statement for Freshwater Management 2020
State
Attribute BandTrend
Sample history at this site
What is this graph showing me?
This graph is displaying ASPM scores over the selected time period. You can adjust this period by changing the dropdowns. These records for the basis for the state and trends displayed on the dashboard.
Find out about how State and Trend are calculated.
What do the attribute band icons mean?
The bands for ASPM are as outlined in the National Policy Statement for Freshwater Management 2020

