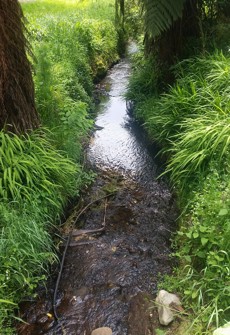
This dashboard shows information on macroinvertebrate data collected by regional councils and unitary authorities. Select an indicator to see the available historical results.
Select a time period
- 10 years
- 15 years
State
Attribute BandTrend
Sample history at this site
What is this graph showing me?
This graph is displaying MCI scores over the selected time period. You can adjust this period by changing the dropdowns. These records for the basis for the state and trends displayed on the dashboard.
Find out about how State and Trend are calculated.
What do the attribute band icons mean?
The bands for MCI are as outlined in the National Policy Statement for Freshwater Management 2020
State
Attribute BandTrend
Sample history at this site
What is this graph showing me?
This graph is displaying QMCI scores over the selected time period. You can adjust this period by changing the dropdowns. These records for the basis for the state and trends displayed on the dashboard.
Find out about how State and Trend are calculated.
What do the attribute band icons mean?
The bands for QMCI are as outlined in the National Policy Statement for Freshwater Management 2020
State
Attribute BandTrend
Sample history at this site
What is this graph showing me?
This graph is displaying ASPM scores over the selected time period. You can adjust this period by changing the dropdowns. These records for the basis for the state and trends displayed on the dashboard.
Find out about how State and Trend are calculated.
What do the attribute band icons mean?
The bands for ASPM are as outlined in the National Policy Statement for Freshwater Management 2020

