
Read this factsheet to find out more on air quality monitoring in New Zealand, including who monitors air quality, and the standards and guidelines that air pollutants are monitored against.
Who is responsible for measuring air quality?
Regional councils and unitary authorities measure outdoor air quality in their regions as part of their responsibilities for managing air quality under the Resource Management Act 1991 (RMA). National Environmental Standards for Air Quality (NES-AQ) are regulations made under the RMA that set limits in outdoor air for PM10, carbon monoxide, nitrogen dioxide, sulphur dioxide and ozone to provide a minimum level of health protection for all New Zealanders.
Regional councils and unitary authorities report on how levels of air pollutants in their towns compare to the NES-AQ and to other guidelines, such as the international World Health Organization (WHO) 2021 air quality guidelines, and the national Ambient Air Quality Guidelines (AAQG) 2002. It’s important to note that the National Environmental Standard (NES-AQ) is legally binding, while the guidelines are advisory.
In many places PM10 levels fail to meet the NES-AQ largely due to emissions from home heating during winter. Most council air quality monitoring programmes focus on measuring PM10 in areas where PM10 levels are highest. Air quality monitoring programmes are very expensive so monitoring focuses on areas known, or suspected, to have issues with air quality. Monitoring air quality helps councils evaluate the effectiveness of resource management plans, strategies and interventions designed to improve air quality. Other monitoring can focus on particular types of pollutants from industry (e.g. nitrogen dioxide from traffic or sulphur dioxide from shipping).
What is measured?
These air pollutants are measured in New Zealand:
- PM10
- PM2.5
- Black carbon
- Carbon monoxide
- Nitrogen dioxide
- Sulphur dioxide
- Ozone
- Benzene
New Zealand air quality standards
The NES-AQ focuses on short term time frames, i.e., average hourly or daily time periods, to provide a set level of protection for communities from the health impacts of air pollution. The NES-AQ allows some pollutants to be above their limits (an exceedance) a small number of times per year.
Table of National Environmental Standards for Air Quality
|
Pollutant |
Time covered |
Limit in air |
Number of exceedances allowed per year* |
|
PM10 |
Daily average (24 hour) |
50 µg/m3 |
1 |
|
Carbon monoxide |
Eight hour running average (8 hour) |
10 mg/m3 |
1 |
|
Nitrogen dioxide |
Hourly average (1 hour) |
200 µg/m3 |
9 |
|
Sulphur dioxide |
Hourly average (1hour) |
350 µg/m3 |
9 |
|
Sulphur dioxide |
Hourly average (1hour) |
570 µg/m3 |
None |
|
Ozone |
Hourly average (1hour) |
150 µg/m3 |
None |
* The number of times that the air pollutant is permitted to exceed the stated limit each year.
Exceedances of air quality standards – PM10
The NES-AQ daily average limit (measured from midnight to midnight) for PM10 is 50 µg/m3. Daily averages greater than 50 µg/m3 are called exceedances. From September 2020, only one PM10 exceedance is allowed per year in many towns. This allows for one-off atypical events (e.g. smoke generated from fireworks).
Air quality guidelines
Not all air quality pollutants are covered by the NES-AQ and so councils may also compare their air quality measurements to New Zealand's Ambient Air Quality Guidelines (2002) (AAQG) or more recent international guidelines, e.g., the World Health Organization (2021) WHO global air quality guidelines. While the NES-AQ only covers short time-frames (e.g. hourly or daily), the AAQG and WHO guidelines also cover annual averages designed to protect communities from the long term or chronic health impacts of air pollution. There are no guidelines for monthly averages.
Regional councils and unitary authorities can also set their own regional air quality guidelines (through their regional plans) which can be the same or stricter than the NES-AQ, AAQG or WHO 2021.
Table of national and international guidelines for air quality indicators shown on LAWA
|
Pollutant |
Time covered |
Limit in air |
Guideline* |
|
PM10 |
Annual average |
15 µg/m3 |
WHO 2021 |
|
PM2.5 |
Daily average (24 hour) |
15 µg/m3 |
WHO 2021 |
|
Annual average |
5 µg/m3 |
WHO 2021 |
|
|
Carbon monoxide |
Hourly average (1-hour) Daily average (24 hour) |
35 mg/m3
4 mg/m3 |
WHO 2021
WHO 2021 |
|
Nitrogen dioxide |
Daily average (24 hour) |
25 µg/m3 |
WHO 2021 |
|
Annual average |
10 µg/m3 |
WHO 2021 |
|
|
Sulphur dioxide |
Daily average (24-hour) |
40 µg/m3 |
WHO 2021 |
|
Benzene |
Annual average |
3.6 µg/m3 |
AAQG |
* WHO – World Health Organization Guidelines; AAQG –Ambient Air Quality Guidelines.
The daily average limits are based on the 99th percentile, allowing 3-4 exceedance days per year.
LAWA air quality data limitations
Raw data vs verified data
Air quality data measured at sites are sent via telemetry to council's databases or computer servers, and then transferred automatically via external servers to LAWA. Air quality data (especially recent hourly, daily and sometimes monthly) are not always able to be checked by councils before being displayed on LAWA. While there are benefits of being able to see real-time data, caution must be applied before using these data, as sometimes the raw data displayed will not be 'real’ because it doesn't represent actual air quality. Non-representative data include very high readings, or spikes (which may look like exceedances), due to an air quality instrument being serviced or calibrated.
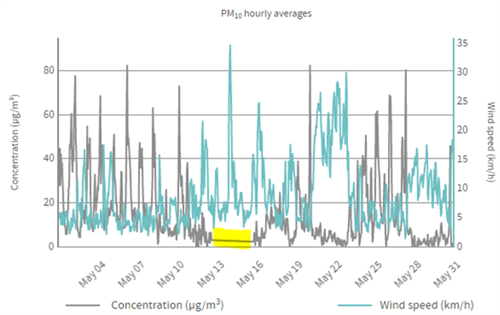
At other times data will be missing, for example, if an air quality monitoring instrument goes off-line or there is a power cut. The missing data is shown as a straight, unchanging, line on LAWA graphs for hourly results. For an example see highlighted section in graph below.
Negative data can occur through what is known as a gradual drift in the way an instrument measures. This drift can be positive or negative around zero and is corrected when a technician carries out a calibration on site. This correction happens at varying intervals in different regions, from weekly to six monthly. Negative data can also occur if there has been a power failure on site, or something else has affected the performance of the instrument. Some instruments are particularly sensitive to dramatic changes in temperature, relative humidity or pressure.
The raw data is periodically checked by councils and any data that is not valid is removed or corrected through their quality assurance / quality control processes. At the site page level the date data have been validated to will be shown for each indicator. However, you should interpret the air quality data displayed on LAWA with care, and if you are unsure about a particular air quality result or wish to use the data for analysis, then check with the responsible regional council or unitary authority to ensure you are using data that has gone through a quality assurance / quality control process.
Measurement methods
Air pollutants are complicated to measure and there are a range of methods and instruments that can be used to collect information on the pollutants. Because of this you cannot always directly compare measurements between sites or regions without making adjustments to the data to account for the different method(s). Regardless of which method is used, you can still see information on air quality trends over time for a town or site. For specific information on the monitoring methods used, please check with the relevant regional council or unitary authority.
Where can I find more information?
Check with your regional council or unitary authority for more information on air quality monitoring in your area.