The Water Quantity section on LAWA allows you to view data on how much water is available and used around the country. It also provides access to real-time data on river flow, rainfall and groundwater levels for over 1000 sites around the country.
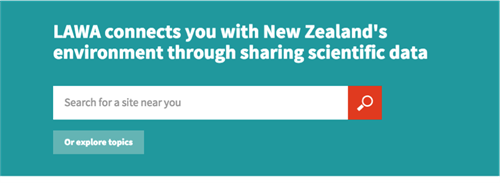
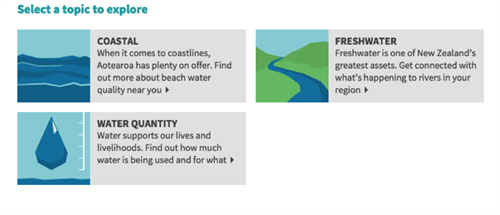
To access the water quantity data first click the “explore topics” button on the homepage and select “Water Quantity from the options.
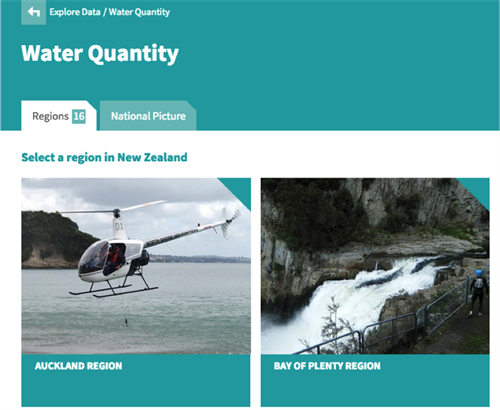
You can then select the region you’d like to look at water quantity data for or click on the “national picture” tab to view data for all of New Zealand.
Regional Water Quantity data
At a regional level you can select one of three questions to view data for:
- How much water is there in this region
- Where does water come from
- How is water used?
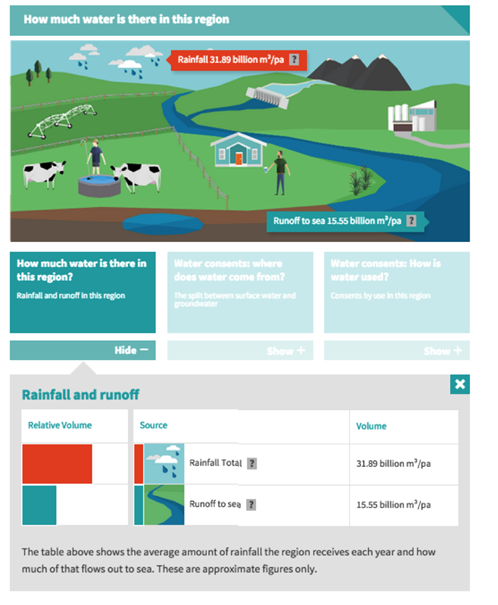
How much water is there in this region?
This tab shows rainfall and run-off to sea data for the region.
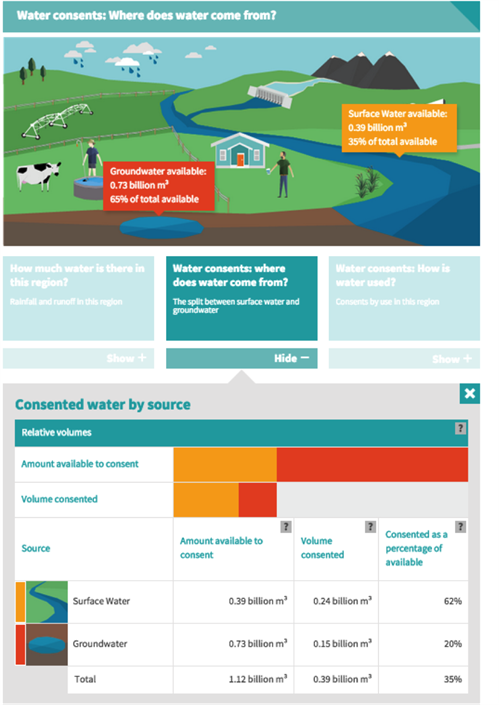
Where does water come from?
This tab shows the amount of water available to consent in the region compared with how much is actually consented and how much is surface water and how much is groundwater.
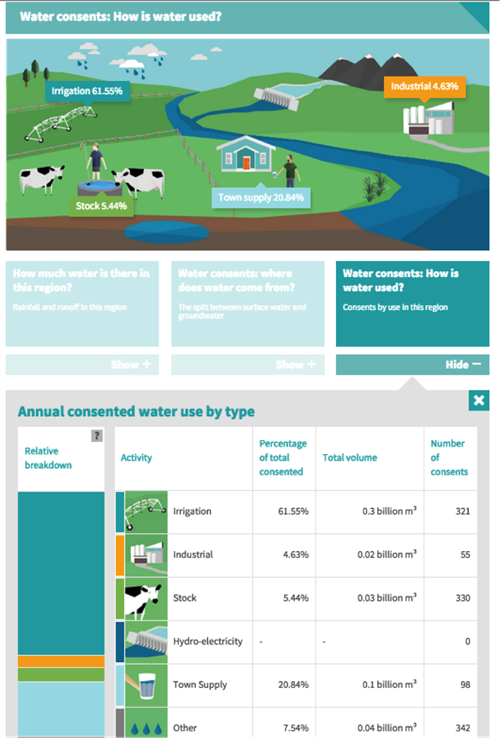
How is water used?
This tab shows you the current consents to take water in the region and for what general purpose (e.g. town supply, irrigation etc). When you click on this tab the map on the left will show you where each of these consents are located. You can zoom in to view more detail for each consent.
Viewing information about a water management zone
Most regions are split into a number of water management zones, both surface and groundwater. Click on one of the tabs to view water management zones available in the region and then select the zone you’d like to view data for.
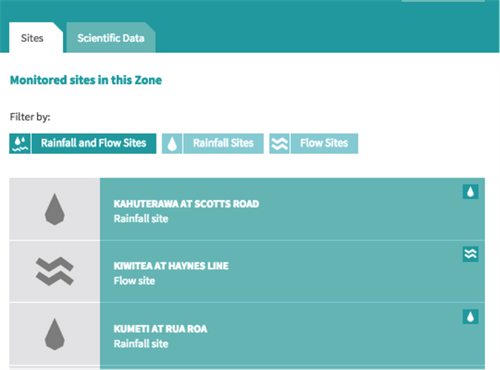
Once you’ve selected a zone you’ll see two tabs as ‘site list’ and ‘scientific data’. The site list allows you to access real time flow, rainfall or groundwater data in water management zone. The ‘Scientific Data’ tab shows you the same type of information available at the regional level
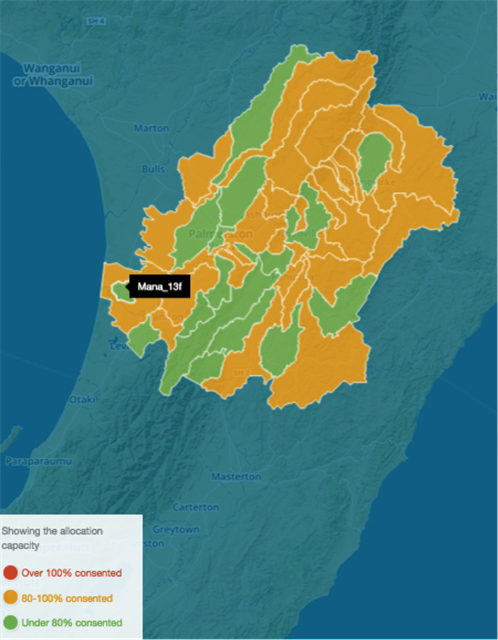
The main difference at a water management zone level is the ability to see the allocation status of areas (sub zones) within each zone. This is displayed on the map to the left when you click on the “Where does water come from tab”.
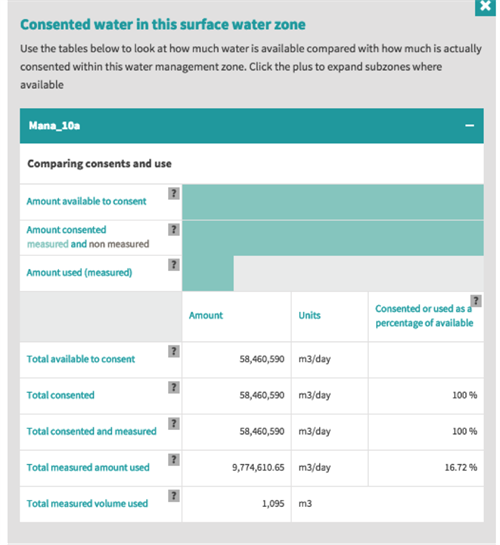
This tab also lets you view more detailed data on the actual water use compared with what’s been consented within these subzones. Simply click the plus to expand each subzone. This data is not currently available for all regions but will be added over time.
Viewing real-time flow, rainfall or groundwater data
LAWA allows you to access the latest rainfall, flow and groundwater level data direct from council monitoring sites.
Rainfall sites:
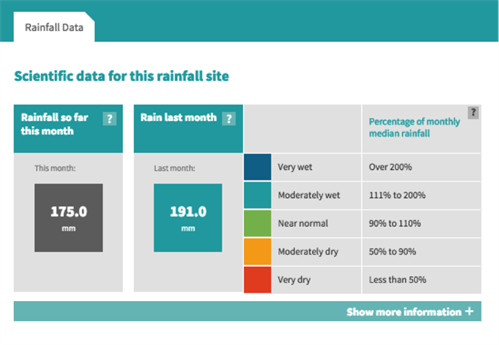
The rainfall data shows you current rainfall total for the month as well as the rainfall for the previous calendar month. The previous calendar month is colour coded according to the expected total for that month (e.g. very dry, near normal, very wet etc). If you want even more detail about the rainfall at the site, click on the “show more information” button.
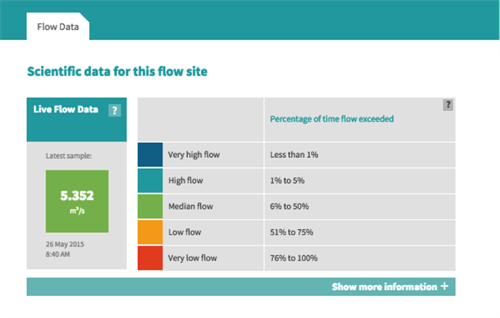
Flow sites:
Flow sites show you the most recent river flow at a site, usually from within the last 15 minutes. The colour coding of the box the flow appears in tells you how the flow compares to typical flows for this site. You can look at the flow over the time (7 days and 30 days) by expanding the “show more information” button.
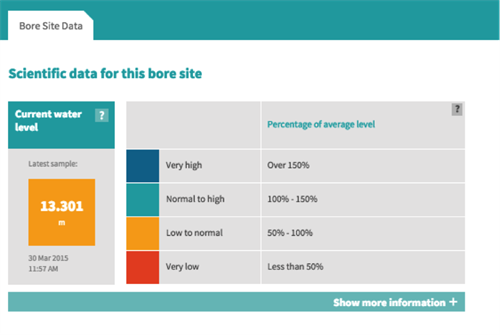
Groundwater sites:
Groundwater sites show you the most recent recorded groundwater level, usually from within the last 15 minutes. The colour coding of the box the water level appears in tells you how the level compares to what is normal for this site. You can look at the groundwater over the time by expanding the “show more information” button.