Questions and answers on the LAWA River Water Quality National Picture Summary (2010 - 2019) released on World Rivers Day 2020.
What does the LAWA River Water Quality National Picture Summary tell us about river water quality from 2010 - 2019?
The summary presents a high-level aggregated picture of the current state of our rivers and streams, how state compares among different land cover types, and how it has changed over time. For the national level analysis, the LAWA team focused on four indicators from the new Freshwater NPS (National Policy Statement):
- E. coli, an indicator of safety of water for human contact.
- Dissolved reactive phosphorus (DRP), a nutrient which can lead to problematic algal growth.
- Macroinvertebrate Community Index (MCI), a biological indicator of ecosystem health.
- Ammonia toxicity, a nutrient which can be toxic to instream life.
Overall, the states of E. coli, MCI, ammonia toxicity, and DRP have not improved over the past 10 years.
How does the state of our rivers vary by different land cover types?
Looking at land cover, there is a consistent pattern for all four indicators that we are focusing on in this national summary. The highest proportion of better scoring streams are found in areas that are predominantly in native vegetation, followed by exotic forest, and then pasture. Urban streams generally receive the worst scores.
How can the data inform freshwater improvement efforts?
The new Government Essential Freshwater package aims to bring New Zealand’s freshwater resources, waterways and ecosystems to a healthy state within a generation. Regional and unitary councils use this data in setting management targets and limits within regional plans to drive regulation and priority areas for more active management.
Looking at state and trend at an individual site or catchment level is useful for community groups, landowners, and other parties interested in how their local waterways are tracking. Interested communities can look at sites on the LAWA interactive river water quality map to view the current state of several indicators and their trends over time, and develop a greater understanding of what’s happening at a catchment, regional and national level. This is available on www.lawa.org.nz/explore-data/river-quality.
How was the national picture generated?
Cawthron Institute led the analyses. The current state of sites from New Zealand’s most comprehensive river water quality network was calculated from a dataset comprising monitoring data regularly collected by all 16 regional and unitary councils and NIWA. The state reflects the NOF bands defined in the National Policy Statement for Freshwater Management 2020.
The evaluation requires an almost complete history of monthly measurements over the previous five years before a grade can be assigned, so not all sites that feature on the LAWA website can be graded. The ‘current state’ for 2019 at each site is based on data from 2015 to 2019.
To look at how state varies between sites in different land cover, we used land cover classes derived from the nationally consistent New Zealand River Environment Classification (REC).
Why is LAWA reporting on the MCI, E. coli, ammonia toxicity, and DRP?
The four key indicators reported on at the national level for the LAWA River Water Quality National Picture Summary (2010 – 2019) are widely recognised indicators of water quality. The LAWA project team worked quickly to respond to the Freshwater NPS 2020 and display these indicators against the new standards.
At an individual site level, LAWA shows nine water quality indicators.
In the future, LAWA will present even more indicators at the national level.
How is river water quality monitored in New Zealand?
All regional councils and unitary authorities in New Zealand monitor water quality in their waterways as part of their State of the Environment monitoring programme. The monitoring is usually done monthly by council environmental officers who collect samples as per national guidelines and send them to an independent laboratory for analysis. The National Institute of Water and Atmospheric Research (NIWA) also administer a water quality monitoring network. Results from New Zealand’s 16 regional and unitary councils and NIWA sites are publicly available on the LAWA website.
What do the different coloured bars in the national summary graphs mean?
LAWA evaluates conditions at sites nationwide against the National Objectives Framework (NOF) described in the new Freshwater National Policy Statement, where expectations of each indicator’s values are defined as achievement bands, from A (good) to D or E (poor).
What does the LAWA interactive river water quality map tell us?
The map shows each site’s results for each indicator, colour-coded by their quartile grade (this is different from NOF bands). This can give an idea of where the best river water quality is, relative to other monitored sites nationwide. The quartile groups are judged against each other, so the worst quartile may not necessarily be ecologically unhealthy, nor may the best quartile be ecologically healthy. They are simply the worst or best of the sites that are monitored.
For MCI (a biological indicator of river health) the NOF band grades for sites are displayed on the map.
How has LAWA responded to the new Government Essential Freshwater package?
The LAWA project team have worked quickly to ensure this year’s national picture summary and water quality data at a site level is responsive to the new freshwater package that came into effect on 3 September. This year, the national-level analysis uses the new National Objectives Framework (NOF) band definitions to show current states of waterways in different land cover types (native, exotic forest, pasture, and urban), and how states have changed over the last 10 years. The indicators we have presented this information for are MCI, E. coli, ammonia toxicity, and DRP.
In the future, we hope to further align our reporting with the recently released Freshwater National Policy Statement 2020 and include information from a wider variety of attributes when data becomes available.
What causes river water quality to degrade?
Polluted run-off is the most significant contributor to water quality decline in New Zealand. Run-off is water running from our land to rivers, lakes, and beaches; along the way this water picks up pollutants such as chemicals and fine sediment from sources such as roads and streets, agriculture, horticulture, forestry, and homes. Some other factors that also impact river health include changes in climate, flow regime, shade, channelisation, pest invasions and blockages to fish passage.
How can people find out more about river water quality near them?
New Zealanders interested in local river water quality can explore river trends and/or state across all nine water quality indicators reported at a local level on LAWA (www.lawa.org.nz) using the interactive river water quality map. Local sites can be found by either clicking on a monitoring site dot on the map, or navigating to the region, then catchment, and then site of interest.
What more do we need to learn?
Year on year we’re learning more about New Zealand’s waterways. Water quality information is now available for 1500 river sites, that’s 400 more individual sites than six years ago. Looking ahead, more information about community freshwater values and desired state is required. Conversations at the national, regional, and catchment level are needed to direct future work programmes.
What is Land, Air, Water Aotearoa (LAWA)?
LAWA aims to connect New Zealanders with their environment through sharing scientific data online. It’s world-leading in its approach to making data collected by authorities freely available to the public. This is made possible by a collaboration of NZ’s 16 regional and unitary councils, the Ministry for the Environment, and Cawthron Institute, with support from the Department of Conservation and Statistics New Zealand. LAWA is committed to sharing the best available information, so New Zealanders can make informed decisions.
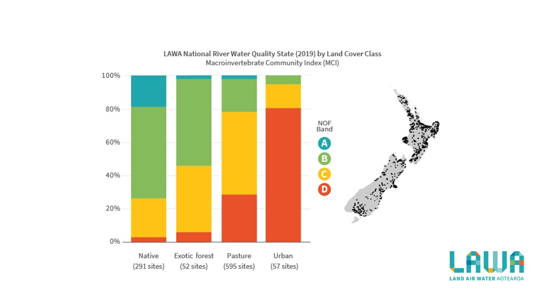
An example from the National Picture Summary investigating current MCI state in areas of different land cover.