Search all sites near me now
Search your favourite swimming spots

Air Quality

Air quality in Nelson is generally good except during cold still nights when air particulates, mainly emitted from home heating get trapped and build up. Nelson has two regularly monitored airsheds.

Nelson’s air story
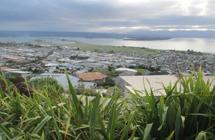
Air quality in Nelson is generally good except during cold and still weather conditions which can occur during the winter. Nelson's location is at the head of Tasman Bay and is flanked by hills on three sides. The hills deflect much of the prevailing wind and as a result Nelson's weather is characterised by low wind speeds and calm conditions usually occurring during winter and often lasting days or weeks on end. During the winter period most air particulate discharges come from home heating fires such as enclosed wood burners (smoke). Where still conditions occur the smoke builds up until the weather conditions change and the wind increases. Other sources of particulates include industrial processes such as boilers, motor vehicles and from natural sources such as airborne sea salt and dust particles.
The particulates from this smoke (and from sea salt, dust and cars) are known as PM10 and PM2.5, these tiny particles can get deep in to our lungs and cause health issues for some people.

Prior to the implementation of the Nelson Air Quality Plan, Nelson’s air quality was amongst the worst in New Zealand. We were the ‘pollution capital of New Zealand’ for frequency of PM10 exceedances. This was based on data for 2001 when Nelson experienced the greatest number of days (81) ever measured in New Zealand when PM10 concentrations exceeded the 50 µg/m3 limit.

Since 2002 we have implemented our Nelson Air Quality Plan, which required a range of measures to be undertaken related to domestic heating and outdoor burning to improve air quality, as well as improvements in PM10 emissions from industrial activities. The good news is our PM10 concentrations now comply with the NESAQ for PM10 and we no longer have ‘polluted’ airsheds. However, in some areas our PM2.5concentrations are above the WHO (2021) guidelines, specifically in the Tāhunanui and Nelson South airsheds.

Regional Summary
PM10and PM2.5at towns in this region

The most significant air pollutant in New Zealand are small airborne particles in our air (known as particulate matter). Particulate pollutants are of most concern in New Zealand because of their high concentrations in some of our towns. Exposure to high levels of airborne particle pollutants has the potential to cause respiratory and cardiovascular issues. View a factsheet on why air quality is important here.

PM10  and PM2.5 are the main concern in the Nelson urban area, particularly during the winter period when cold still conditions prevent dispersion and allow the particulate matter to build up. Exposure to PM can have short and long term health effects. The Council reports on annual and daily concentrations each year along with trends for the monitoring sites at St Vincent St (Nelson South) and Blackwood St (Tahunanui). 

PM monitoring history at towns in this region

  • Annual average
  • Highest daily average
  • Exceedance
Showing:
PM10

What is this showing me?

The graph enables you to view the annual average and highest daily average concentrations of PM10 and number of exceedance days for the year selected. The results are compared to the relevant air quality standard or guideline (denoted by the red horizontal line). See this factsheet for more information about the PM10 measurements, and the standards and guidelines used to report on. 

Values above the standard or guideline shown can be a cause for concern as short- or long-term exposure to high PM10 can have health impacts.  See this factsheet about why air quality is important and factors that influence air quality. 

The trends in the table below indicate whether the PM10 concentrations have been improving, showing no measurable change, or declining over the 10-years prior to the year selected. (For towns that have more than one monitoring site, a representative site is shown).

Data table PM10
Towns 10-year Trend annual average (µg/m³) Highest daily average (µg/m³) 2nd highest daily average (µg/m³) Number of exceedances
PM2.5

What is this showing me?

The graph enables you to view the annual average and highest daily average concentrations of PM2.5 and number of exceedance days for the year selected. The results are compared to the World Health Organization guidelines (denoted by the red horizontal line). See this factsheet for more information about the PM2.5 measurements, and the standards and guidelines used to report on. 

Values above the guidelines can be a cause for concern as short- and long-term exposure to high PM2.5 values can have health impacts.  See this factsheet about why air quality is important and factors that influence air quality. 

Any trends in the table below indicate whether the PM2.5 concentrations have been improving, showing no measurable change, or declining over the 10-years prior to the year selected. (For towns that have more than one monitoring site, a representative site is shown).

Data table PM2.5
Towns 10-year Trend annual average (µg/m³) Highest daily average (µg/m³) 2nd highest daily average (µg/m³) Number of exceedances
Towns 4

Towns in the Nelson region

Select the town you'd like to see information on by clicking the buttons below or navigate using the map.