Search all sites near me now
Search your favourite swimming spots

Christchurch

Christchurch is the largest urban area in Canterbury. While Christchurch has a number of commercial and industrial areas within it, the land area is predominantly residential. There are 25 sites where air monitoring has been carried out since 1988, of which three are currently active (white dots on map). The seasonal variation below comes from data collected at the Woolston monitoring site as there was no active St Albans site during 2021.

Air quality is currently monitored in St Albans (residential), Woolston (residential and industrial), and Riccarton Road (traffic and residential). In the past monitoring has been carried out in other suburbs to understand air quality across Christchurch.

The graph below gives an overview of when PM10 has been monitored in various suburbs and how concentrations have varied over time and between suburbs. Each coloured line shows the highest daily PM10 average each month and uses a scale from 0 to 200 ug/m3, with the red line at 50 ug/m3 for each site.  The zero line for each monitoring site is the same as the 200 ug/m3 line for the site below it in the graph. 

Highest 24 hour average PM10 concentration measured each month at various monitoring sites in suburbs of Christchurch.

Town Summary
Air quality in this town

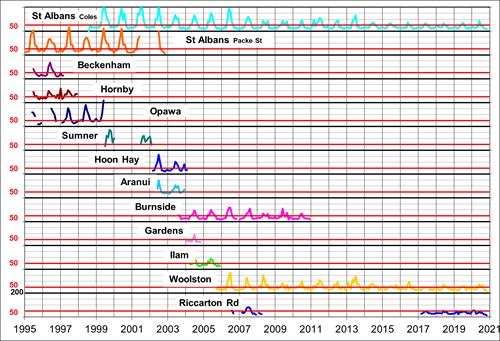
In Christchurch, most of the PM is from the burning of wood for home heating. Other outdoor sources of PM are motor vehicles, industrial and commercial processes, and natural sources. PM concentrations are typically highest during winter evenings, when temperatures are coldest and there is little wind.

Sources of air pollution

Home heating Industrial Outdoor burning Traffic Indoor sources Natural sources
  • Show Hide
    • Sources of PM10 emissions
    • Sources of PM2.5 emissions
    • Sources of NOx emissions
    Source Annual percentage Winter day percentage
    Home heating Home heating {{emissions.annualhome}}% {{emissions.winterhome}}%
    Industrial Industrial {{emissions.annualindustry}}% {{emissions.winterindustry}}%
    Outdoor burning Outdoor burning {{emissions.annualoutdoor}}% {{emissions.winteroutdoor}}%
    Traffic Traffic {{emissions.annualmotor}}% {{emissions.wintermotor}}%
    Relative breakdown
    Annual
    Winter day

    The table shows the proportions of the main sources of PM10, PM2.5 and nitrogen oxides (NOx) in this town from home heating, industrial activities, outdoor burning and traffic.  (Indoor, natural and shipping sources are not included in this breakdown). 

    These values come from 2013 data sourced from MfE’s data service.  Consistent methodology was used to calculate these estimates of PM and NOx emissions, which allows comparison between towns throughout New Zealand.  Regional council or unitary authority published emissions information might differ if they were prepared in a different year or used another method. Contact your regional council or unitary authority for more information about PM and other emissions in your area.

Seasonal variation

  • Show wind speed
  • Show temperature
Showing:

PM10


PM2.5


Wind speed (km/h)


Air temperature (℃)

What is this graph showing me?

The graph shows the monthly average PM concentrations at one representative site in this town for the year selected. In many towns in New Zealand, PM peaks in the winter when air temperatures and wind speeds are lowest as more people heat their homes during colder weather, and still conditions mean that there is no wind to disperse the air pollutants.

Sites 26
Monitored sites in Christchurch

Monitored sites in this town can be categorised according to location:

  • Residential: Air monitoring site is in a suburban area with a relatively high population density, but not close to a busy road or industry.
  • Traffic: Air monitoring site is very close to a busy road or intersection.
  • Industry: Air monitoring site is close to industry, including heavy commercial and processing factories.
  • Coastal: Air monitoring site is close to the coast where there are high levels of sea salt in the air.
  • NES: A site monitored for compliance with the National Environmental Standards for Air Quality (NES-AQ).

...retrieving sites.

No sites found.

Show more