What are benthic macroinvertebrates?
Benthic macroinvertebrates are small animals without backbones that live on or just below the stream-bed. Most benthic macroinvertebrates are big enough to be seen with the naked eye, and range in length from 0.25 mm to 15 cm in the case of a fully grown freshwater crayfish (kōura). Most are the larvae of insects but other groups such as snails, worms and crustaceans are also common.
Benthic macroinvertebrates are extremely important for processing terrestrial and aquatic organic matter. Benthic macroinvertebrates reflect stream health via their central role in stream ecosystems where they feed on periphyton, macrophytes, dead leaves and wood, or on each other. In turn, they are an important food source for animals further up the food chain, such as wading birds and fish. When the insects become adults they leave the water and become food for animals such as birds, bats, spiders, etc.
How to measure river or stream health using invertebrates
Benthic invertebrate communities are widely used as indicators of stream ecosystem health because they include a wide range of species, each with relatively well-known sensitivity or tolerance to stream conditions. The most common stream health indices described the proportion of sensitive Ephemerotera, Plecoptera, and Trichoptera (EPT) species relative to other macroinvertebrates and the Macroinvertebrate Community Index (MCI) suite of indices that were designed specifically for New Zealand streams.
Taxa richness
Taxa richness is considered a very coarse indicator of stream health, which is measured by counting the number of different species of invertebrates present in a sample. The benthic invertebrate community typical of pristine conditions has a high variety of species or “taxa”. In general, high taxa richness is considered good, although mildly impacted (nutrient-enriched) rivers can have higher taxa richness than pristine streams and rivers.
Percentage of EPT taxa
Macroinvertebrate communities contain three orders of insects that are typically sensitive to degradation: the mayflies, stoneflies, and caddis flies. Together, these insects are known as EPT, referring to their scientific names Ephemeroptera, Plecoptera and Trichoptera, respectively. These freshwater insects are generally intolerant of pollution, so the poorer the stream health, the fewer will be found in a sample relative to tolerant species. Indices describing the richness (number of different types) of EPT or relative proportions of EPT are useful indicators of stream health.
The percentage of EPT-taxa (or %EPT) is most commonly calculated by counting the total number of mayfly, stonefly and caddis fly taxa in a sample, then dividing that number by the total taxa richness (number of all taxa present) and multiplying by 100. This is known as the %EPT by taxa. A similar metric can be calculated to compare the relative proportions of EPT individuals (rather than types) and is denoted %EPT-abundance.
A high percentage of EPT-taxa indicates good stream health. However, in some New Zealand streams there are naturally few mayflies, stoneflies, or caddis flies present. Ecologists need to be aware of these factors when using the %EPT to assess the ecological health of a river or stream.
Macroinvertebrate Community Index (MCI)
The MCI for a stream site takes into account the presence (or absence) of invertebrate species. The MCI is based on the tolerance or sensitivity of species (taxa) to organic pollution and nutrient enrichment. For example, mayflies, stoneflies and caddis flies are generally sensitive to pollution, and can only thrive in clean and healthy streams, whereas worms and snails are more tolerant and can be found in more polluted streams.
Most benthic invertebrate taxa have been assigned a tolerance value ranging from 1 (very tolerant) to 10 (very sensitive). MCI is derived from the average tolerance value of all taxa present at a site, multiplied by 20. Higher MCI scores indicate better stream conditions at the sampled site. In theory MCI values can range between 0 and 200, but in practice it is rare to find MCI values greater than 150 and only extremely polluted or sandy/muddy sites score under 50.
Quantitative Macroinvertebrate Community Index (QMCI)
The QMCI uses the same tolerance scores as the MCI, but uses the relative abundance of macroinvertebrates to determine an index of stream health. The QMCI is considered more sensitive to subtle changes in water quality and stream health because it responds to changes in the relative of proportions of different species rather than the presence of absence. QMCI scores range from 0 to 10.
Average Score Per Metric (ASPM)
The ASPM index is an aggregation of three other metrics that are averaged to indicate stream health. The component metrics are the MCI, the richness of Ephemeroptera, Plecoptera and Trichoptera excluding Hydroptilidae (EPT-taxa) and %EPT abundance.
Important to know
The MCI and QMCI were designed originally for stony riffle substrates in flowing water. This means that when interpreting scores some knowledge is needed of the types of instream habitat where the invertebrate samples were collected. For example, some streams in New Zealand naturally have low numbers of high-scoring taxa such as mayflies, stoneflies or caddis flies, which may be due to the geology, climate, flow regime or a natural absence of riverbank vegetation. These streams may have low MCI scores, but may not in fact be degraded. To help overcome this at sites with naturally silty and sandy, soft-bottom substrates a set of different tolerance values have been developed for use at these sites. Ecologists need to be aware of these factors when using the MCI to assess the ecological health of a river or stream.
How do I sample benthic macroinvertebrates?
Macroinvertebrate samples are collected typically from wadeable streams. Two common methodologies for sampling macroinvertebrates are kick-netting (sometimes called hand-netting) and Surber sampling (see examples of sampling equipment for each of these techniques below). Which method to use depends on the reason for collecting the samples and the characteristics of the sampling site.
|
|
|
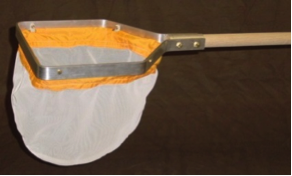
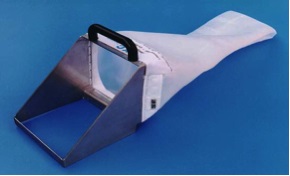
Example of a kick-net (left) and a Surber sampler (right).
Kick-nets are generally used when you want to know about the diversity of invertebrates or the general ecological health of a stream or river. Kick-netting is a 'semi-quantitative' sampling technique, where the sample is not collected from a defined area of streambed. The kick net can be used in a broad range of stream types including bouldery sites and soft bottomed streams with dense macrophyte beds.
A Surber sampler is used when you want to know the number of invertebrates in a defined area of streambed, for example per square metre. This is important if you want to understand how productive a stream or river is. Surber samples cannot be used where there are large boulders present or where sampling is focused on woody debris or macrophytes.
What else needs to be considered when sampling for benthic macroinvertebrates?
Timing
In New Zealand, the presence or absence or the relative numbers of different invertebrate groups does not vary between seasons as much as in stream communities overseas. Therefore, communities can be sampled at any time of the year to calculate stream health indices such as EPT taxa richness and the MCI suite. However, to reduce uncertainty when comparing sites and investigating long-term trends, it is preferable to sample during the same season each year.
Flooding can drastically alter a macroinvertebrate community, although communities often recover quickly. If the focus of monitoring is on general stream health the short-term effects of a flood could produce misleading results. Therefore, invertebrates are generally not sampled within 2 - 3 weeks following a large flood to allow the macroinvertebrate communities time to recover.
Habitat considerations
The richness and abundance of invertebrates can vary a lot within a stream. For example, there may be a greater variety and number of invertebrates in shallow, swift riffles than in deep, slow-flowing pools; and invertebrates that inhabit the slower flowing margins of a steam may be different to those in swifter areas. It is therefore important to give thought to where in the stream invertebrates are being collected from.
Comparing between methods
Regional councils may use subtly different methods to collect macroinvertebrates, process the samples and calculate indices. The differences may have implications for the comparison of results between regions. However, a national environmental monitoring standard for macroinvertebrates has recently been developed and is envisaged to be rolled out over the next few years. This standardisation of methods will make regional and national comparisons more rigorous.
Where do I find more information?
Chapman, Lewis and Winterbourn 2011. Guide to freshwater crustacea of New Zealand.
National Environmental Monitoring Standards 2022. Macroinvertebrates: Collection and processing of macroinvertebrate samples from rivers and streams. Version 1.0.0
Stark JD 1985. A macroinvertebrate community index of water quality for stony streams. Prepared for National Water and Soil Conservation Authority. Water & Soil miscellaneous publication. 53p. p.
Stark JD, Boothroyd IKG, Harding JS, Maxted JR, Scarsbrook MR 2001. Protocols for sampling macroinvertebrates in wadeable streams. 1-57 p.
Stark JD, Maxted, JR 2007. A user guide for the Macroinvertebrate Community Index. Prepared for the Ministry for the Environment. Cawthron Report No. 1166. 58
Winterbourn, MJ, Gregson, KLD and Dolphin, CH 2006. Guide to the aquatic insects of New Zealand.